Abstract
Fork’s related structural design and detail have a significant impact on the overall performance of a forklift. In this paper, the structural stress analysis and strength calculation of the fork were carried out firstly, and the rated load calculations considering dynamic and unbalanced conditions were performed. Also, the restraint conditions were analyzed. Then, a finite element model was established using ANSYS software. In particular, the fork’s structure was optimized by increasing the fillet radius of the fork root and the variation rules between the fillet radius and the maximum structural stress and minimum fatigue life were numerically studied, which was in accordance with the mathematical models of ExpAssoc and Logistic regression, and the corresponding fitting coefficients of R2 was respectively equal to 0.99 and 0.96. Overall, the stress concentration issue of the fork root was improved and the structural strength perquisite was satisfied when using a fillet radius of 75 mm. Both the numerical calculations and theorized mechanical analysis show consistency, where the stress concentration was observed in the fork root’s fillet area, testifying the accuracy of the established finite element model. The numerous methods employed in this work lay an important theoretical basis for the structural optimization of the target fork.
Keywords: Fork, finite element modeling, stress analysis, fatigue life, structural optimization
1. Introduction
Fatigue damage is one of the main reasons for failure of mechanical parts [1-2]. As the most important working device of a forklift, the fork often works continuously, withstands impact loads of different degrees and different working conditions, and easily causes structural fracture in stress concentration areas. This requires that fork must have good working performance and structural strength adaptability. Therefore, stress characteristics and fatigue life are two important factors to be considered in the fork design. Structural strength design and optimization are the research focuses of forklifts.
The traditional methods of stress analysis and fatigue research are mainly carried out through static calculation and prototype trial-manufacture, and modified according to the experimental results [3-4]. However, it takes a lot of cost to repeat the above work. With the development of finite element numerical simulation technology and the wide application of large-scale commercial finite element software, the method of calculating structural strength and predicting component fatigue life based on computer aided design (CAD) and finite element method (FEM) has been widely used in engineering field [5-8]. Scholars also mainly used numerical calculation methods to study fork’s structural characteristics. Rouch and Joung [9] analyzed static stresses in the telescopic masts of forklift earlier, using FEM, and the error of analysis and test was less than 10%. Xu et al. [10] established a finite element model of the transition block in fuel-injection pump fork to predict the highest stress concentration areas, and through observation, it was found that the maximum stress gradient direction was in agreement with the crack initiating direction. Kumar and Yoo [11] pointed out that analyzing and designing the fatigue load and structural strength for shifting fork by FEM were more time-saving and cost-saving than testing, and simulation results were satisfied. Sun et al. [12] had made static strength analysis and fatigue lifetime expectation research from the perspectives of FEM and accumulated damage. Koo et al. [13] established the design process of casting beam in a forklift to predict the fatigue life by FEM, and the findings provided a guidance on solving the problem when the failure was occurred. Gu et al.[14] analyzed the simplified fork structure and the rated payload, then accomplished the static analysis based on ANSYS, and simulation results provided a theoretical reference for the structural design of the forklift fork. Wang and He[15] performed finite element analysis software of ANSYS to analyze the mechanical properties of two kinds of structures commonly used in forks at present, and a basic conclusion was gotten that the hanger-type fork fitted for the environment with light load and high work efficiency.
It can be summarized that the FEM is used to numerically analyze and calculate the structure characteristics. The verified FEM has high simulation precision and visualization, and can directly obtain the stress field of the whole model, which is a feasible method to solve practical engineering problems [16-18]. In this paper, structural mechanics and fatigue life of a target fork are studied by FEM with ANSYS to optimize its structural strength.
2. Materials and Methods
2.1 Main structural parameters
At present, there are two kinds of fork structure for forklift:hanger type and hollow shaft type [15]. Because the hanger-type fork is easy to be replaced and has good stiffness, it has become the mainstream type and is widely used. The fork device model analyzed in this paper is provided by a enterprise, and its three-dimensional model is illustrated in Figure 1 .
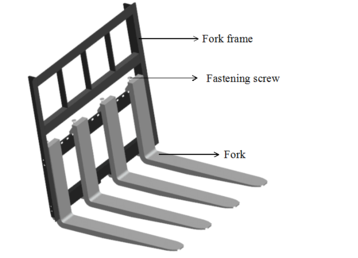
|
| Figure 1. Structure model of fork device |
The model equipment consists of three parts: a fork frame, four forks and four fastening screws. Actually, cargoes with a certain load are placed directly on the fork. Under the action of the hydraulic cylinder system, the door frame drives the fork to realize the lifting, descending and loading and unloading of cargoes. Four forks are evenly and symmetrically distributed on the fork device. In order to facilitate force analysis and later numerical calculation, only a single fork was taken to analyze, and its structural parameters were specified by relevant standards [15,19].
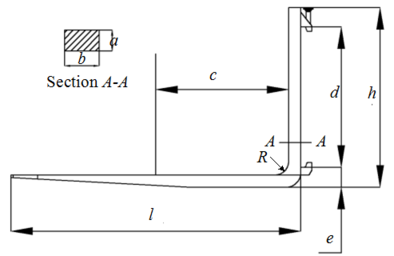
As is shown in Figure 2, the main structural parameters of the fork are horizontal length , vertical section height and vertical section size , in which is the thickness and is the width, is the fillet radius of the fork root.
| Figure 2. Main structural parameters |
The lifting weight and the load center distance basically determine the overall appearance size of the fork. According to ISO/DIS 1214-79 standard, when the rated load of this forklift is 3 tons (T), the load center distance is mm. The basic size parameters of the fork were obtained from the relevant standards and measurements, as listed in Table 1.
| Parameters | Value | Parameters | Value |
|---|---|---|---|
| Horizontal length | Two hinge pivot center distance | ||
| Vertical Height | Extension distance | ||
| Section size | ; | Fillet radius of the fork root |
2.2 Force analysis and strength calculation
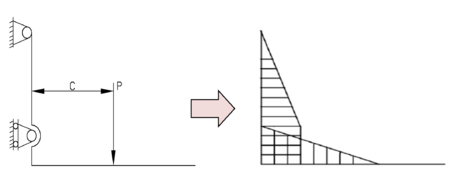
The fork studied in this paper is a widely used hanger type, that is, the fork and the fork frame are connected by a fastening screw described particularly in Figure 1. According to the actual assembling, lifting and unloading of the forklift, the lower support can be simplified as a movable hinge support; since there is an installation clearance at the upper support, it is not absolutely unable to rotate, so the fork can be simplified as a statically determinate rigid frame supported on two hinges. Most literatures [14-15,19] regard the load as a concentrated load, and therefore its stress analysis and bending moment diagram can be obtained, as shown in Figure 3.
|
| Figure 3. Structural force and corresponding bending moment diagram |
Mechanical analysis results indicate that under the action of concentrated load , the dangerous section of the fork structure exists at or below the section in Figure 2, and the specific stress concentration part needs to be analyzed and determined by finite element numerical calculation.
The rated load acts directly on the fork. Considering the phenomenon of instantaneous impact and uneven load-bearing caused by eccentricity, the maximum load is multiplied by the dynamic load coefficient , where , and the partial load coefficient (generally taken as 1.1) [14]. The resulting load of the fork is thus
|
|
(1) |
Under the concentrated load , the horizontal section is subjected to bending moment and shearing force, while the vertical section is subjected to bending moment and tension force. The vertical section below section is dangerous, and the maximum normal stress of the dangerous section is the sum of bending stress and axial stress. The bending stress and axial stress are obtained by the following formulas, respectively
|
|
(2) |
|
|
(3) |
Therefore, the maximum normal stress is expressed as
|
|
(4) |
where and are the maximum bending moment and bending section modulus, respectively; is the cross-section area of vertical section; is the material yield strength, and for the 40Cr, is not less than 539 MPa; is the structural safety factor, which can be calculated by Eq.(4)
|
|
(5) |
The safety factor indicates that the fork has certain section strength, but whether there is structural stress concentration remains to be further analyzed and determined. Additionally, the structural allowable strength can be acquired by Eqs.(4) and (5), namely .
2.3 Finite element modeling and calculation
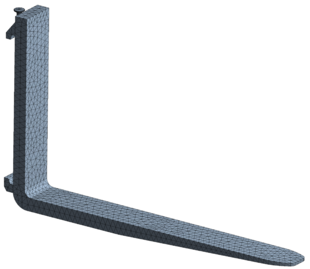
Accurate and reliable computational model is the basis of finite element analysis. This paper used the seamless interface between Pro/E and ANSYS to import the entity model into Workbench, and triangular element mesh was used, as shown in Figure 4. The mesh size was 10 mm, and 17272 nodes and 10247 cells were generated.
|
| Figure 4. Mesh model |
The actual structural material is 40Cr steel, and its specific mechanical properties are listed in Table 2 and added in ANSYS.
The fork is subjected to the continuous downward gravity of cargoes in the actual work. When the analysis was carried out, the gravity was equivalent to a concentrated force, and the concentrated force was applied in the center of the fork. Considering the actual influence of dynamic and partial loads as described above, the concentrated force was the rated load and added in Workbench, and the load was set as force load. In addition, the hinged supports were added according to the actual situation to ensure the rigid body displacement and rotation of the restrained structure.
| Elastic modulus | Poisson's ratio | Yield stress | Density |
|---|---|---|---|
| 2.06 MPa | 0.28 | 550 MPa | 7.87 |
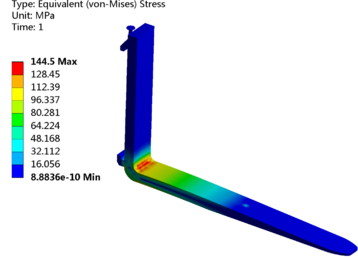
Based on the above finite element model, the stress nephogram of the fork was calculated by static solution, as illustrated in Figure 5. Clearly Figure 5 indicates that under concentrated load, the fork has stress concentration problem in the fillet area of the fork root. The finite element calculation results are in accordance with the theoretical force analysis, which verifies the accuracy of the model to a certain extent. However, the maximum stress of the structure is 144.5 MPa, which is greater than the allowable stress 119.8 MPa. When the fork is subjected to continuous load, it may cause the surface to be damaged or even broken due to insufficient strength. Therefore, it is necessary to carry out structural improvement design on the original fork, and the main part of optimization is the stress concentration area, that is, the fillet area of the fork root.
| Figure 5. Result of finite element analysis |
3. Results and discussion
The above-mentioned structural stress analysis and finite element analysis results have shown that the stress concentration is mainly in the fillet area of the fork root. Therefore, in order to enhance the structural strength of the weak part, the measures of gradually increasing the fillet radius of the fork root were proposed, and the radius were selected as 35mm, 45mm, 55mm, 65mm and 75mm, respectively, and the weight of the forklift load was still 3T.
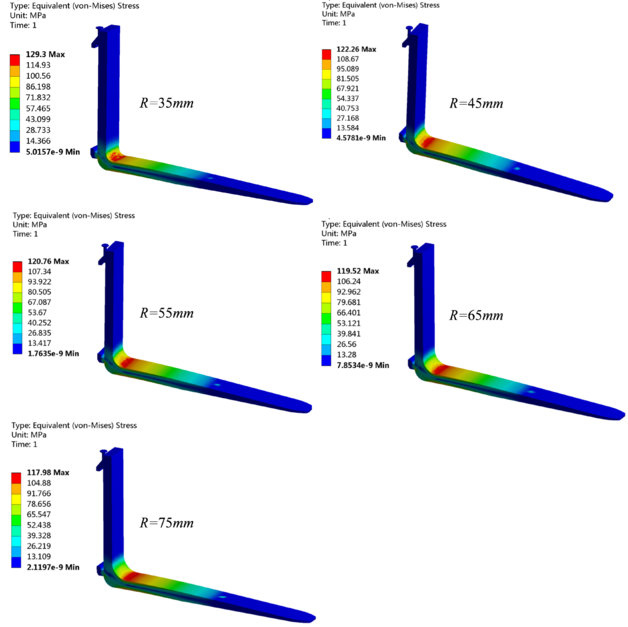
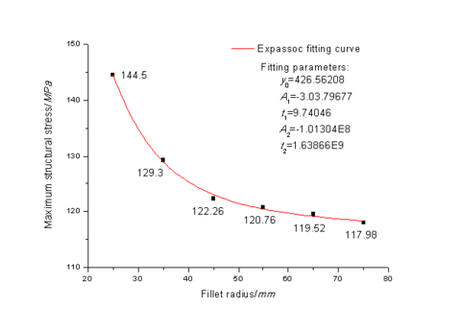
The improved three-dimensional structure model was imported into Workbench, where the constraints and loads were consistent with those before the improvement (namely, mm), and the stress distribution maps under different fillet radius were obtained by numerical calculation, as presented entirely in Figure 6. The relationship between the maximum structural stress and the fillet radius was fitted by a function curve, which is shown in Figure 7.
|
| Figure 6. Stress nephograms under different fillet radius of the fork root |
|
| Figure 7. Functional fitting curve of maximum structural stress and fillet radius |
Figure 6 makes it clear that the stress concentration always exists in the fillet area of the fork root, and the maximum stress decreases with the increase of the fillet radius, which is mainly because the fillet structural of fork root is strengthened. This conclusion is consistent with the research results in Ref. [19]. And the maximum stress with the fillet radius of 75mm is 117.98 MPa, less than the 1.82 MPa of the allowable stress.
Figure 7 visually reflects that the maximum stress of the fork root varies non-linearly with the increase of the fillet radius. That is, when the radius of fillet is less than 45 mm, the maximum stress decreases rapidly, and the fillet radius has a great influence on the structure stress; when the radius of fillet is greater than 45 mm, the maximum stress decreases to be stable, which means that the fillet radius has little influence on the structure stress; the fitting results demonstrate that the correlation between the fillet radius and the maximum stress is in accordance with ExpAssoc model, and the mathematical model is expressed as
|
|
(6) |
In the formula, the specific values of the fitting parameters are listed in Figure 7. The fitting coefficients of reaches 0.99, indicating that ExpAssoc model describes the variation between the fillet radius and the maximum stress well.
Fatigue life prediction of engineering machinery parts has no theoretical formula to solve, most of which are based on finite element technology for analysis and calculation [6-7,13]. The FATIGUE module of ANSYS Workbench is an effective method to solve the fatigue life problem based on the elastic-plastic assumption and the Miner cumulative fatigue criterion [20]. To be clear, under different stresses, Miner theory has good estimation accuracy and is suitable for the actual working condition of this case.
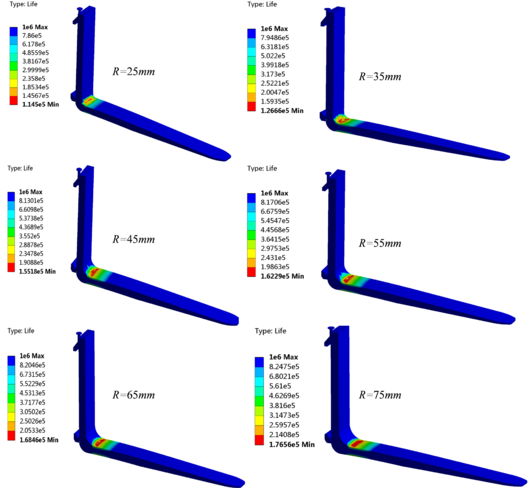
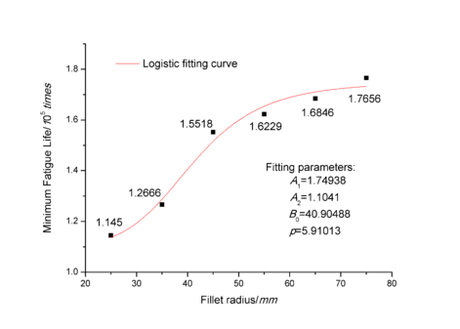
In this section, the FEM was used to predict and analyze the fatigue life of the fork to further study and compare the structural strength characteristics before and after improvements. When the numerical calculation of stress was completed, the FATIGUE module and Zero-based load type were added and the fatigue strength factor was set to 8. As the Goodman theory has been widely used in durability analysis and consistent with the average stress correction for fatigue analysis of fork structure, the cloud images of fatigue life analysis were obtained based on Goodman theory, as illustrated in Figure 8. The relationship between the minimum fatigue life and the fillet radius was fitted with a function curve, and the result is shown in Figure 9.
|
| Figure 8. Fatigue life nephogram under different fillet radius of the fork root |
|
| Figure 9. Functional fitting curve of minimum fatigue life and fillet radius |
Figure 8 clearly presents that the structure fatigue mainly occurs in the fillet area of the fork root, which is consistent with the aforementioned relationship between the fillet radius and the maximum stress, and conforms to the basic mechanics theory that stress concentration can easily lead to structural fatigue failure. When the fillet radius are 25mm and 75mm, the minimum fatigue life of fork are times and times, respectively, and the minimum fatigue life increases with the increase of the fillet radius, which indicates that structural fatigue damage of the fork root is less likely to occur.
The fitting result in Figure 9 presents the relationship between fillet radius and fatigue life is a non-linear Logistic regression model (=0.96). The mathematical model can be expressed as follows
|
|
(7) |
In the formula, the specific values of the fitting parameters are listed in Figure 9. It can be found that when the fillet radius is less than 45mm, the slope of the curve is larger, indicating that the minimum structure fatigue life increases greatly, and the fatigue life of the structure is significantly affected; Conversely, the influence of the larger fillet radius on the fatigue life becomes smaller, which also corresponds to the relationship between the fillet radius and the maximum stress.
Based on the above analysis results of structural stress and fatigue strength, considering the load 3T, the fork is prone to excessive and may cause surface damage or even breakage in the fillet area of the fork root, which is a dangerous working condition. Consequently, it is more appropriate to change the fillet radius to 75mm to meet the strength requirement that the maximum stress is less than the allowable stress.
4. Conclusion
Forklifts are widely used in short-distance handling, and high-load cargoes and working strength impose high performance requirements on forks. The fork’s structural design plays a key role in the efficiency and reliability of the forklift. On the basis of discussing the structure position, connection relationship and main structural parameters of the fork device, this paper analyzed the fork’s stress conditions, calculated the rated load, and obtained the safety factor and the allowable stress by calculating the maximum section normal stress.
According to the actual use of the fork, the constraint conditions and force loads for finite element analysis were determined. After adding geometric model, meshing, setting material parameters, constraints and loads, the finite element calculation model of the original fork was established, and the numerical calculation results show that the stress concentration exists in the fillet area of fork root. Aiming at this problem, a solution to increase the fillet radius was proposed. The optimal design of the fillet area at the fork root was carried out. The fillet area was optimized, and the improved model was obtained. It is concluded that the relationship between the fillet radius and the maximum structural stress conforms to the ExpAssoc model. In order to further research the fork’s structural characteristics, the fatigue life was preformed based on the FATIGUE module of ANSYS and Goodman correction theory. The fatigue nephogram and the curve relationship between the fillet radius and the minimum fatigue life were obtained by finite element numerical calculation, which is in accordance with the non-linear Logistic regression model. The minimum fatigue life increases with fillet radius, and the structure with the fillet radius of 75mm has the satisfied fatigue life, which further verifies the accuracy of the foregoing fork stress analysis and also provides a mathematical model for fork life prediction.
In this paper, the fork’s structural mechanics and fatigue life were analyzed by FEM, and a structural optimization scheme meeting the allowable strength requirement was proposed. Based on the results of theoretical and numerical calculation, the actual structural improvement and application of the target fork will be the future work.
Fundings
The work was supported by the Natural Science Foundation of Fujian Province (2018J01483), China Postdoctoral Science Foundation (2019M662252) and Doctoral Scientific Research Fundation of Chengyi University College (CK17063).
Acknowledgments
The work was also supported by Outstanding Young Scientific Research Talents Cultivation Plan of Fujian Universities, and thanks to the engineering technology research institute of Xiamen XGMA Machinery Co., Ltd for providing original model data.
Conflicts of Interest
The authors declare no conflict of interest.
References
[1] Massone J.M., Boeri R.E. Failure of forklift forks. Engineering Failure Analysis, 17:1062-1068, 2010.
[2] Gubeljak N., Zerbst U., Oblak M. Application of the European SINTAP procedure to the failure analysis of a broken forklift. Engineering Failure Analysis, 11:33-47, 2004.
[3] Jigh B.H.G., Hosseini-Toudeshky H., Farsi M.A. Low cycle fatigue analyses of open-celled aluminum foam under compression-compression loading using experimental and microstructure finite element analysis. Journal of Alloys and Compounds, 797:231-236, 2018.
[4] Zhen C.B., Feng G.Q., Wang T.L., Yu P.Y. Numerical and experimental study on trimaran cross-deck structure's fatigue characteristics based on the spectral fatigue method. Journal of Marine Science and Engineering, 7:62, 2019.
[5] Silveira J.A., Mezzomo G.P., Goedel F. Evaluation of structural stress method and master curve for fatigue life prediction of a welded joint. Revista Internacional de Métodos Numéricos para Cálculo y Diseño en Ingeniería, 33:318-328, 2019.
[6] Surendran M., Natarajan S., Palani G.S., Bordas PA. Linear smoothed extended finite element method for fatigue crack growth simulations. Engineering Fracture Mechanics, 206:551-564, 2019.
[7] Bergara A., Dorado J.I., Martin-Meizoso A., Martinez-Esnaola J.M. Fatigue crack propagation in complex stress fields: Experiments and numerical simulations using the Extended Finite Element Method (XFEM). International Journal of Fatigue, 103:112-121, 2017.
[8] Zhou Y.D., Tao J.Y. Theoretical and numerical investigation of stress mode shapes in multi-axial random fatigue. Mechanical System and Signal Processing, 127:499-512, 2019.
[9] Rouch K.E., Joung K.S., Dean A. Structural analysis of mast by finite element technique. Allis-Chalmers Engineering Review, 39:20-23, 1974.
[10] Xu X.L., Yu Z.W., Yu B. Fatigue failure of an intermediate transition block in fuel-injection pump fork assembly of a truck diesel engine. Engineering Failure Analysis, 94:13-23, 2018.
[11] Kumae V.J., Yoo Y. Shift fork test correlation procedure for structural strength. In: FISITA World Automotive Congress, October 2-5 October, 2018.
[12] Sun K.Z., Zhou J.Y., Zhu F.X. Fatigue reliability analysis on the special fork of the transmission. International Journal of Control and Automation, 7:121-130, 2014.
[13]Park J.H., Koo J.M., Lee O.Y., Seok C.S. Steeraxle casting beam design of forklift truck by fatigue life analysis. Journal of the Korean Society for Precision Engineering, 28(11):1309-1315, 2011.
[14] Gu X., Wang W.J., Lin N., Zhang G., Gu G.X. The finite element analysis for fork based on ANSYS. International Conference on Electrical, Electronics and Mechatronics, 20-21 December, pp. 152-154, 2015.
[15] Wang H.Q., He H.Z. Analysis and design improvement on mechanical properties of two kinds of fork based on ANSYS. Machinery Design & Manufacture, 9:38-40, 2011.
[16] Lima M., Rocha P.A.S., Silveira R.A.D., da Silva K.I. Analysis and design of concrete structures using strut and tie model by FEM: Application in foundation blocks, short consoles, wall beams and rigid shoes. Revista Internacional de Métodos Numéricos para Cálculo y Diseño en Ingeniería, 35, 2, 2019.
[17] Liu H.Y., Huang X.H, Wang S.M., Hu Y., Yuan T.P., Guo G.X. Evaluation of the structural strength and failure for floating collar of a single-point mooring fish cage based on finite element method. Aquacultural Engineering, 85:32-48, 2019.
[18] Yue J.X., Dong Y., Guedes C.G. An experimental-finite element method based on beach marks to determine fatigue crack growth rate in thick plates with varying stress states. Engineering Fracture Mechanics, 196: 123-141, 2018.
[19] Li H., Ning W.Y., Tang X.Y., Wei Y.Q. Finite element analysis and optimal design of forklift. Machinery, 52:24-27, 2014.
[20] Fan Y.B., Yin M.D., Ding Q. Research on fatigue life for forklift fork based on ANSYS workbench. Coal Mine Machinery, 36:105-106, 2015.
Document information
Published on 25/03/20
Accepted on 20/03/20
Submitted on 16/12/19
Volume 36, Issue 1, 2020
DOI: 10.23967/j.rimni.2020.03.002
Licence: CC BY-NC-SA license
Share this document
Keywords
claim authorship
Are you one of the authors of this document?
