Abstract
Wire electrical discharge machining (EDM) possesses many advantages over the conventional manufacturing process. Hence, this process was used for machining of all conductive materials; especially, nowadays this is the most common process for machining of aerospace aluminum alloys. This process produces complex shapes in aluminum alloys with extremely tight tolerances in a single setup. But, for good surface integrity and longer service life, the residual stresses generated on the components should be as low as possible and it depends on the setting of process parameters and the material to be machined. In wire EDM, much of the work was concentrated on Titanium alloys, Inconel alloys and various types of steels and partly on aluminum alloys. The present investigation was a parametric analysis of wire EDM parameters on residual stresses in the machining of aluminum alloy using Taguchi method. The results obtained had shown a wide range of residual stresses from 8.2 to 405.6 MPa. It also influenced the formation of various intermetallics such as AlCu and AlCu3. Microscopic examination revealed absence of surface cracks on aluminum surface at all the machining conditions. Here, an attempt was made to compare the results of aluminum alloy with the available machined data for other metals.
Keywords
Wire EDM; Aluminum; DOE; Intermetallic; Residual stress
1. Introduction
Wire electrical discharge machining (WEDM) was an important unconventional machining process. Earlier, the EDM processes were mainly intended for machining of hard metals, but in today’s manufacturing sector, it was used for machining of all types of conductive materials due to its ability to machine precise, complex, and irregular shapes of the surfaces [1] and [2]. Any machining process that induces residual stresses on the surface may be beneficial or detrimental to the service life of machined parts depending on their magnitude and sign. From the literature, it was observed that production grinding generates compressive stresses at the surface and slight tensile peak just beneath it. On the contrary turning process generates tensile stresses at the surface and a compressive peak just below the surface. Irrespective of material and conditions in most of the cases milling process generates compressive stress at surface and sub-surface of the components whereas both EDM processes (Die-sinking EDM and wire EDM) generate tensile stress at the surface and a maximum tensile peak just beneath the surface. So, among the prominent machining processes the preferable stress state in grinding components, least detrimental stress state in turning components, beneficial stress state in milled components and detrimental stress state in EDMed components were observed [3]. The tensile stresses adversely affect several functional aspects such as fatigue life [4], corrosion and wear resistance [5] and [6], as they promote crack formation and propagation by fatigue or corrosion cracking [7].
In view of this many researchers attempted to find the effect of various factors in the generation of residual stresses on EDMed components. Ghanem et al. [4] found the tensile residual stresses during machining of EN X160CrMoV12 tool steel and by performing polishing operation on the same surface a stabilized compressive residual stress was observed. Very low residual stresses were observed by Soo et al. [8] during machining of Ti–6Al–2Sn–4Zr–6Mo aerospace alloy in both rough and finish cut operations in wire EDM. Ekmekci [9] studied the effect of dielectric liquid and electrode type in the generation of residual stresses due to EDM. The experiments were conducted on plastic mold steel (DIN 1.2738) materials by using two different tool electrodes and dielectric liquids. The combination of graphite and kerosene as electrode and dielectric respectively produced highest residual stress values. Ekmekci et al. [10] developed a qualitative relationship between EDM parameters and residual stresses with respect to various operating conditions. Navas et al. [3] conducted experiments on AISI 01 tool steel for comparing the surface integrity generated by various processes viz., wire EDM, turning and grinding. Among the above three processes wire EDM had shown detrimental effect on surface integrity. Ghanem et al. [11] measured the surface residual stresses on hardenable (tool steel type X155CrMoV12 and high carbon content steel type C90) and non-hardenable steels (austeX2CrNiMo17-12-02 and ferritic steel type X6Cr17) which were machined by EDM. They observed varied residual stresses on components and all were tensile in nature. Kruth and Bleys [12] performed the machining operations on C 45 tool steel and observed that peak stresses were located somewhat below the surface but not on the surface. Mamalis et al. [13] conducted residual stress experiments on micro alloyed and dual phase EDMed steel and compared the results with 100Cr6 steel components and they found that peak stresses were almost independent of discharge energy. In contrast to the above Newton et al. [14] found a decrease in residual stress with an increase in energy per spark during machining of Inconel 718. Bonny et al. [6] studied the impact on tribological characteristics of WC–Co hard metals and correlated the results with residual stresses. They found varied residual stresses by varying Co percentage and addition of small percentage of other elements viz., Vanadium and Chromium.
Majority of the work in EDM processes was performed on various types of metals which include Inconel alloys, Titanium alloys and steels. As EDM is a thermo electric process, the components machined by this machine tool are influenced by thermal properties of the material especially thermal conductivity and melting point [15] and [16]. Work was performed on different materials including Inconel 718, Ti6Al4V, AISI H13 tool steel, AISI 304 stainless steel, EN8 medium carbon steel. Though the materials are different their thermal conductivity and melting point vary within a narrow range of approximately 6.7–28.6 W/m K and 1336–1660 °C respectively. In order to completely study the effect of wire EDM parameters on various materials it was suggested to select a material having properties different from the above, i.e., high thermal conductivity and low melting point. The materials such as aluminum alloys possess the above properties and the components made from aluminum alloys were in high demand in aerospace, satellite and defense applications often referred as aerospace aluminum alloys. These aluminum alloys were lighter, corrosion resistant and stronger than many steels. The latest five-axis machining centers and multi-axis turning centers can produce various shapes of aluminum components with tight tolerances, whereas, wire EDM and sinker EDM machines were generally used for production of complex shapes of aluminum components with extremely tight tolerances in a single setup. Since there was no contact with the workpiece in EDM it produces very fine shapes that were not possible with traditional machining. Hence this process was used for machining of a wide variety of products, such as hydraulic and injection mold components, aerospace structural components, extrusion dies and form tools. With today’s high speed wire EDM machines high quality parts can be produced economically [17], but for longevity of the above components the magnitude of tensile residual stresses should be as low as possible and free from surface cracks. The existing literature in WEDM on aluminum alloys was mostly restricted to measuring of a few responses [18] and [19] such as surface roughness, material removal rate, and white layer thickness; so there was a dearth of information for finding the effect of wire EDM parameters on residual stresses. In aerospace applications primarily utilized aluminum alloy was 2024-T4, and for applications where higher strength was required the following alloys 2014-T6, 7075-T6, 7079-T6 and 7178-T6 were commonly used. Aluminum 2014 T6 was used for making wing tension members, shear webs and ribs in aerospace applications. Here, aluminum 2014 T6 having thermal conductivity of 154 W/m K and melting point 638 °C was selected to find the influence of process parameters on residual stresses.
2. Experimental strategy and setup
The authors of this paper conducted the initial experiments on wire EDM by considering eight parameters viz., pulse on time, pulse off time, peak current, flushing pressure of dielectric fluid, wire feed rate, wire tension, spark gap voltage and servo feed rate using L18 orthogonal array (OA) [20]. The selection of L18 OA for eight parameters with three levels gives a low resolution so the main effects of the parameters can only be obtained but not the interaction effect among the parameters. From the results of initial experiments it was found that the parameters pulse on time, peak current and spark gap voltage had shown significant effect on various performance measures. Hence, the above three parameters with two levels as given in Table 1, were only selected for residual stress experiments using L8 OA. The parametric optimization was performed by Taguchi method. The experimental strategy used here was full factorial design of high resolution, which facilitates evaluation of main effects, 2-way and 3-way interaction effects on residual stresses. The factors and their interactions assigned from first to seventh column of L8 OA were as follows: pulse on time (TON), peak current (IP), interaction between pulse on time and peak current (TON∗IP), spark gap voltage (SV), interaction between pulse on time and spark gap voltage (TON∗SV), interaction between peak current and spark gap voltage (IP∗SV) and interaction of pulse on time, peak current and spark gap voltage (TON∗IP∗SV).
| Control factors | Symbol | Level 1 | Level 2 | Units |
|---|---|---|---|---|
| Pulse on time (TON) | A | 105 | 110 | μsec |
| Peak current (IP) | B | 10 | 12 | Ampere |
| Spark gap voltage (SV) | C | 8 | 22 | Volts |
All the machining operations were conducted on Ultra Cut 843/f2 CNC wire EDM. The de-ionized water was used as dielectric fluid and the electrode was zinc coated brass wire. The size of the workpiece was 15 × 20 mm and the thickness was 10 mm. Residual stress measurements were made in the direction of feed using PANalytical X-Pert Pro materials research diffraction (MRD) system. The intermetallic phases which were developed during machining were also identified by the same system. The scanning electron microscope (SEM) photograph was taken by using JEOL JSM-6610LV with and without applying etchant on the surface to observe the possible formation of cracks. The composition of etchant used in this investigation was distilled water 92 ml, nitric acid 6 ml, and hydrofluoric acid 2 ml and the samples were immersed in this bath for a period of 15 s. The cutting speed values which were displayed on the monitor slightly vary about a mean value because of improper flushing of debris resulting in varied voltage and hence cutting speed. So the average of the above readings in mm/min was considered as a cutting speed value for each machining condition. The surface roughness measurements were done on stylus type profilometer and Talysurf 10 with a cutoff length of 0.8 mm and an average of five readings had been recorded.
In this investigation macroscopic residual stresses were measured only in the aluminum phase using the conditions given in Table 2. Apart from aluminum being a major phase intermetallic phases of AlCu and AlCu3 were observed at different machining conditions. The highest peak for aluminum phase was in {1 1 1} plane at 2θ ≈ 38° but residual stress measurement in aluminum phase was generally performed at higher 2θ angles; hence, the next highest peak which was localized at 2θ ≈ 99° in {4 0 0} plane was observed by using cobalt radiation (λ = 1. 78901 Å) where θ was the diffraction angle. The lattice spacing was measured in 5 ψ tilts and 3 Φ angles, where Φ was the angle of strain on the sample surface measured from principal stress and an angle ψ defines the orientation of the sample surface. In order to simplify the calculations shear stress values were considered null as an initial hypothesis. The calculations were performed using “Stress plus” XRD software module.
| Target | Cobalt |
|---|---|
| Wavelength (Å) | 1.78901 |
| Filter | Iron |
| Current (mA) | 40 |
| Voltage (kV) | 45 |
| Goniometer tilt | Ψ |
| Young’s modulus (GPa) | 72.4 |
| Poisson’s ratio | 0.33 |
| Diffraction angle (°) | ≈99° |
| Number of Ψ angles | 5 (−45° to +45°) |
| Number of Φ angles | 3 (0°, 45° and 90°) |
3. Results and discussion
3.1. Design of experiments for residual stresses
The Signal to Noise (S/N) ratio (η) analysis was conducted to find an optimal setting of parameters in which signals were predominant and eventually it leads to a situation in which the system was less sensitive to noise. The residual stresses observed are given in Table 3, which were tensile in nature, so higher levels of these show detrimental effects and hence “Lower is Better” type of characteristic was selected. The S/N ratio values were calculated using Eq. (1), where ‘y’ was the individual measured response value and ‘n’ was the number of measurements. Irrespective of the type of characteristic the largest value of S/N ratio indicates the optimal condition of the parameter for the given response.
|
|
(1) |
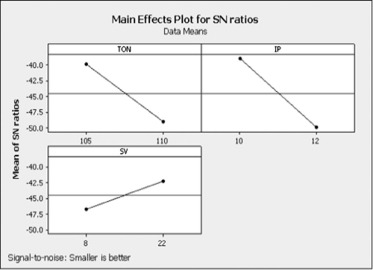
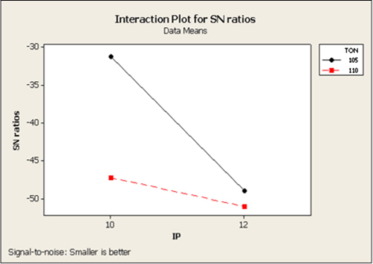
The S/N ratio analysis was made using MINITAB 15 software and the values obtained are given in Table 4. The main control factors (TON, IP or SV) have significant effect on the reported residual stress values since the S/N ratio changes significantly with the change in the levels of these factors. It shows the minimum and maximum S/N ratios for each factor and the difference between the ratios was known as delta. The higher the delta, the most significant the effect of the factor on performance measure and the corresponding factor was awarded with highest rank [21]. So among the main control factors IP had shown most significant effect followed by TON and SV. The effect of main control factors on residual stresses as given in Fig. 1 indicates that the factor at level 1 for TON, level 1 for IP and level 2 for SV gives minimum residual stress value and hence an optimal combination was obtained at A1B1C2, as it was known that the largest value of S/N ratio indicates the optimal condition for the corresponding factor. If the effect of one factor depends on the other factor, then the interaction plot was useful to visualize the possible interactions. The greater the difference in slope between lines, then higher the degree of interaction. However, the interaction plot does not give whether the interaction was statistically significant or not. Fig. 2 shows the interaction effect of TON & IP on residual stresses.
| Trial no. | Residual stresses (MPa) | ||||
|---|---|---|---|---|---|
| TON | IP | SV | Replicate 1 | Replicate 2 | |
| 1 | 105 | 10 | 8 | 67.5 | 90.6 |
| 2 | 105 | 10 | 22 | 22.1 | 8.2 |
| 3 | 105 | 12 | 8 | 299.2 | 309.0 |
| 4 | 105 | 12 | 22 | 269.5 | 245.8 |
| 5 | 110 | 10 | 8 | 236.4 | 232.3 |
| 6 | 110 | 10 | 22 | 218.9 | 229.8 |
| 7 | 110 | 12 | 8 | 405.6 | 382.0 |
| 8 | 110 | 12 | 22 | 328.2 | 317.1 |
| Level | TON | IP | SV |
|---|---|---|---|
| 1 | −39.86 | −39.00 | −46.73 |
| 2 | −49.12 | −49.99 | −42.26 |
| Delta | 9.26 | 10.99 | 4.47 |
| Rank | 2 | 1 | 3 |
Smaller is better.
|
|
|
Figure 1. Effect of control factors on residual stresses. |
|
|
|
Figure 2. Interaction plot between TON∗IP for residual stresses. |
The significance of individual parameters and their interactions on residual stresses was obtained by analysis of variance (ANOVA). The results of ANOVA for residual stresses are given in Table 5. The variables used in ANOVA were defined as follows: DF = Degree of freedom, Seq.SS = Sequential sums of squares, Adj.SS = Adjusted sums of squares and Adj. MS = Adjusted mean squares. P-value determines the appropriateness of rejecting the null hypothesis in a hypothesis test. A confidence level of 95% (α = 0.05) was used throughout the analysis. So, the P-values which were less than 0.05 indicate that null hypothesis should be rejected and thus the effect of respective factor was significant.
| Source | DF | Seq SS | Adj SS | AdjMS | F-value | P-value |
|---|---|---|---|---|---|---|
| TON | 1 | 67,392 | 67,392 | 67,392 | 490.05 | 0.000 |
| IP | 1 | 131,515 | 131,515 | 131,515 | 956.33 | 0.000 |
| SV | 1 | 9168 | 9168 | 9168 | 66.67 | 0.000 |
| TON∗IP | 1 | 11,004 | 11,004 | 11,004 | 80.02 | 0.000 |
| TON∗SV | 1 | 213 | 213 | 213 | 1.55 | 0.248 |
| IP∗SV | 1 | 477 | 477 | 477 | 3.47 | 0.099 |
| TON∗IP∗SV | 1 | 1544 | 1544 | 1544 | 11.23 | 0.010 |
| Error | 8 | 1100 | 1100 | 138 | ||
| Total | 15 | 222,414 |
S = 11.7269 R-Sq = 99.51% R-Sq (adj) = 99.07%.
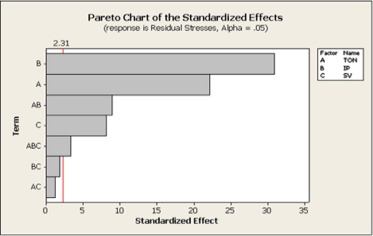
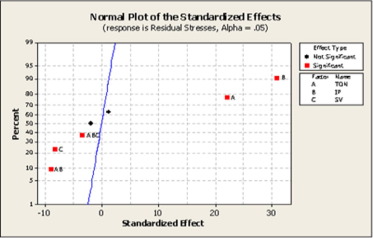
The absolute value of source terms is displayed in a Pareto chart as shown in Fig. 3. It consists of a reference line on the chart corresponding to a ‘α’ value of 0.05. The effects that past this reference line were potentially important. Normal plot of the standardized effects is shown in Fig. 4. The sources which were away from the line had significant effect and the sources near to zero were not significant. From the two figures it was observed that the parameters IP, TON, TON∗IP, SV and TON∗IP∗SV were potentially important and its relative effect on residual stresses was in decreasing order.
|
|
|
Figure 3. Pareto chart of the standardized effects of residual stresses. |
|
|
|
Figure 4. Normal plot of the standardized effects of residual stresses. |
Analysis of the results leads to the conclusion that factors at level 1 for TON (A), level 1 for IP (B) and level 2 for SV (C) give minimum residual stresses, so the optimal combination was obtained at A1B1C2. The parameters TON, IP, SV, and interactions TON∗IP and TON∗IP∗SV had shown significant effect, whereas interactions TON∗SV and IP∗SV had shown no effect on residual stresses. Residual stresses on wire EDMed components occur through the combined effect of different mechanisms, including plastic deformations, phase transformations and temperature gradients [9]. Plastic deformations induce the compressive residual stresses by mechanical load and tensile residual stress by thermal load [3]; on the other hand phase transformations led to the change in volume of surface and sub-surface layers, so the decrease or increase of its volume was hindered by bulk material resulting in generation of tensile or compressive residual stresses respectively. The effect of temperature gradients produces tensile residual stresses on the machined component [6]. All the residual stresses observed were in-plane tensile in nature; matching with other research [6] and [22] this indicates the predominant effect of temperature gradients and phase transformations on the machined component in the generation of residual stresses. The experimental results presented in this manuscript were supported by using some more experimental findings. In order to save cost and time these supporting experiments were performed only on a few surfaces machined at identified condition.
3.2. Identification of cases
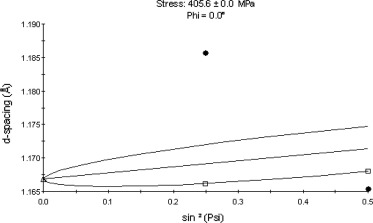
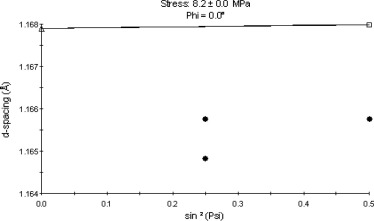
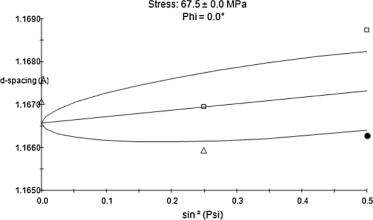
From Table 3 it was observed that the highest residual stresses were obtained at the following machining condition of TON = 110 μsec, IP = 12A and SV = 8 V which was referred as case-1 (Trial 7 in Table 3). Similarly the least values of residual stresses were obtained at the following machining condition TON = 105 μsec, IP = 10 A and SV = 22 V which was referred as case-2 (Trial 2 in Table 3). In order to study the effect of spark gap voltage and spark energy on residual stresses another machining condition at TON = 105 μsec, IP = 10 A and SV = 8 V was considered, which was referred as case-3 (Trial 1 in Table 3). The reason for considering case-3 was to facilitate the comparisons between case-1 and case-3 (which had the same spark gap voltage i.e. SV = 8 V) & case-2 and case-3 (which had the same TON and IP) to find the effect of spark energy and spark gap voltage. Figure 5, Figure 6 and Figure 7 show the d-spacing and resulting residual stress values at cases-1, 2 and 3 respectively. In X-ray diffraction method, the stress magnitudes were determined through measurement of changes in the materials lattice spacing (d) due to the presence of a stress. The fractional change in ‘d’ was the strain, which can be related to stress using Hooke’s law [23]. The experimental findings presented in this manuscript can be supported by performing additional experiments viz., cutting speed, surface roughness, phase and microscopic analysis on the above three identified cases.
|
|
|
Figure 5. Lattice spacing versus sin2 ψ at case-1 condition. |
|
|
|
Figure 6. Lattice spacing versus sin2 ψ at case-2 condition. |
|
|
|
Figure 7. Lattice spacing versus sin2 ψ at case-3 condition. |
3.2.1. Cutting speed and surface roughness
The cutting speed values of ∼3.24, ∼0.83 and ∼1.37 mm/min were found in cases-1, 2 and 3 respectively, whereas, the roughness value of 3.70 μm at case-1, 1.61 μm in case-2 and 2.01 μm at case-3 was measured. The surface roughness and cutting speed values were found to have an increasing trend with the increase of TON and IP matching with what had been reported by others [18] and [24]. At the same time it decreases with the increase of spark gap voltage as reported earlier [25]. Though the energy per spark at each machining condition was not measured it was known that increase in energy per spark increases the cutting speed [26] and surface roughness values [27] which results in increased temperature gradients. When a temperature gradient of sufficient magnitude was created in the workpiece material plastic deformation occurs. This plastic deformation causes the expansion of the surface layer due to heat, and during cooling the surface layer contracts resulting in a tensile residual stress. It was also known that higher values of TON [28] and IP [29] increases the discharge energy results in higher temperature gradients may be a reason for higher values obtained in case-1 condition. Low cutting speed values in case-2 condition indicate the long exposure time which may have relieved the residual stresses so it can be a reason for lower values of residual stresses. Comparing case-3 with case-1 the parameters TON & IP were varied and all the remaining other parameters were set at constant. A change in value of 67.5–405.6 MPa from case-3 to case-1 respectively indicated the interaction effect of TON & IP on discharge energy and its dominant control in generation of residual stresses. On comparing case-3 with case-2 the parameter SV was only varied and the remaining parameters were set at constant. The residual stress values of 67.5 and 8.2 MPa were obtained when the parameter SV was set at lower and higher levels in case-3 and case-2 respectively. The higher value of SV means that the gap was enough for ionization to occur and current will flow if this gap was too small, and the current can take a path of least resistance and a high current arc was seen which results in increased thermal gradients and hence increased residual stress values. So it was clear that SV as an individual parameter and in combination with TON & IP had a significant effect on the residual stresses.
3.2.2. Phase analysis
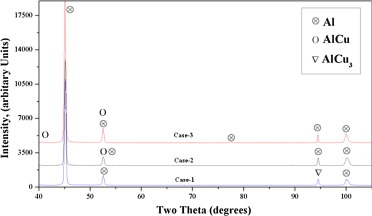
The formation of various intermetallic phases on the workpiece during machining can also be a reason for the generation of residual stresses. The phase analysis was made on the surfaces machined at the above three cases. The material under investigation was a 2XXX series type of aluminum–copper (Al–Cu) alloy and therefore various intermetallic phases of Al–Cu can be observed on the machined surface. The phase analysis on the machined surface was started by listing various possible intermetallics in Al–Cu series. The Al–Cu intermetallics in various applications allowed us to identify the following solid solution phases (intermetallic compounds) from the direction of aluminum as Al, AlCu, Al2Cu, AlCu3, AlCu4, Al2Cu3 and Al4Cu9[30]. A mixture of phases gives a pattern that was made up of patterns of all the individual phases. So to identify the phases present in a mixture the 2θ values and corresponding lattice spacing (d) values for the strongest peaks were stored in the computer. These values were then compared with the large database available in the X-pert pro MRD software. If the ‘d’ values for any of the above listed Al–Cu phase match with the stored values then the corresponding phase was said to be present. The X-ray diffraction patterns are shown in Fig. 8 with 2θ angle varying from 40° to 105°, with 1 sec per step and a step size of 0.050°. In this investigation the AlCu3 (β-phase) was observed at a 2θ angle of approximately 94.5° in case-1, whereas AlCu (η-phase) phase was observed at a peak of 52.53° in case-2 and at the peaks of 40.62° and 52.55° for case-3. The formation of above intermetallics depends on the formation energies attained in KJ/mol per atom. Here, the formation of these compounds was governed by the energies generated during the wire EDM process which were eventually influenced by the parameters and their levels. The formation energy of AlCu was less when compared to AlCu3, which indicated a relatively weak chemical interaction between Al & Cu [31]. So the formations of AlCu3 phase in case-1 and AlCu in case-2 itself indicated the generation of high and low spark energies respectively. The intermetallic compound obtained in case-3 was same as in case-2 which showed that the increased spark energies due to lower levels of SV may not be sufficient to form a new phase in the series of Al–Cu intermetallics. The various phases observed on the wire EDMed surface viz., Al, AlCu and AlCu3 were also the reason for varied residual stresses in this investigation.
|
|
|
Figure 8. XRD pattern for cases-1, 2 and 3 machining conditions. |
3.2.3. Surface cracks
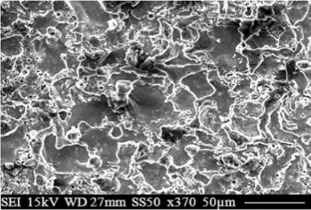
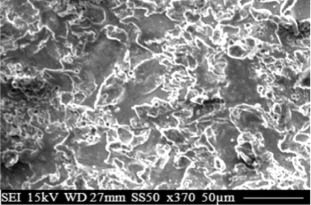
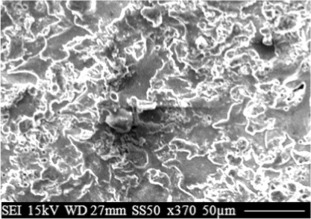
Surface cracks were not observed at all the cases in machining of aluminum 2014 T6 alloy. The SEM photograph shown in Figure 9, Figure 10 and Figure 11 was taken at cases-1, 2 and 3 respectively which consists of rippled surface, a number of cavities and overlapping craters all these demonstrated a wire EDM surface similar to what has been previously reported by others [32], [33] and [34] but no surface cracks were found. The formation of surface cracks was attributed to the differentials of high contraction stresses exceeding the material’s ultimate tensile strength [35] but the maximum residual stress value of 405.6 MPa obtained in this investigation was less than the ultimate tensile strength (483 MPa) of aluminum 2014 T6 alloy. The melting and re-solidification of the material caused the formation of white layer on the surface; as it appears white under microscope it was called white layer [7], [9], [36] and [37]. The aluminum 2014 T6 alloy was highly thermal conductive (154 W/m-K); hence, more volume of the material was thermally damaged but the induced thermal gradients between white layer and bulk material may not be sufficient to generate cracks. Formation of surface cracks relieves the stress levels on the surface and leads to a shift of peak tensile residual stress to various depth profiles [38] and with the increase in energy per spark increases the depth of the peak tensile stress [12]. Absence of surface cracks in this investigation indicated that the residual stresses observed on the surface can be considered as a maximum value for that component. This was the reason for not conducting residual stress measurements at various depth profiles. Though surface cracks were not observed higher values of tensile residual stresses were not preferred as it promotes the formation of cracks.
|
|
|
Figure 9. SEM photograph of wire EDMed surface in case-1 condition. |
|
|
|
Figure 10. SEM photograph of wire EDMed surface in case-2 condition. |
|
|
|
Figure 11. SEM photograph of wire EDMed surface in case-3 condition. |
The negligible residual stress value of 8.2 MPa in case-2 was observed during machining of aluminum alloy whereas it was not in the case of other metals machined with EDM processes. For example, Navas et al. [3] obtained the surface residual stress value of 420 MPa and 190 MPa during rough and finishing conditions respectively in the machining of AISI O1 tool steel. Ekmekci (2007) [9] found the varying surface residual stress values in the range of 220–320 MPa in the machining of plastic mold steel. Ghanem et al. [4] found the intensity of surface residual stresses on hardenable and non-hardenable steels of approximately 750 and 500 MPa respectively. Newton et al. [14] measured surface residual stresses of Inconel 718 and the surface residual stresses of approximately 200–450 MPa were observed. Ghanem et al. [4] found the tensile residual stress of 750 MPa and by applying the secondary process of polishing on the same surface a compressive residual stress value of 130 MPa was observed during machining of tool steel. Bonny et al. [6] found varied residual stresses in the range of 100–500 MPa during machining of WC–Co hard metals. The above comparisons between hard and soft metals on residual stresses were not scientific as machining of different materials was not done at the same conditions but it gives a peripheral idea about the role of machining conditions and the scope for further reduction of residual stresses on different materials.
4. Conclusions and future scope
The residual stress measurements were made on aluminum 2014 T6 alloy and all the stresses were observed to be in-plane tensile in nature. The S/N ratio analysis was conducted and an optimal parameter setting was obtained at level 1 for TON, level 1 for IP and level 2 for SV where low or negligible residual stresses were observed. Analysis of variance was conducted at a confidence level of 95% and it was found that all the main control factors TON, IP and SV had shown significant effect. Among the interactions one 2-way interaction (TON∗IP) and 3-way interaction (TON∗IP∗SV) had shown significant effect, whereas the rest of the interactions TON∗SV and IP∗SV had shown no effect on residual stresses. The relative effect of parameters and interactions on residual stresses was in decreasing order of IP, TON, TON∗IP, SV and TON∗IP∗SV. Increased residual stress and surface roughness values were observed with an increase in cutting speed. The spark energies generated during machining at various conditions led to the formation of various intermetallic phases viz., AlCu and AlCu3. The AlCu3 intermetallic observed in case-1 condition was much more anisotropic than other intermetallics, so its formation must be either prevented or controlled. The maximum residual stress value obtained in this investigation was 405.6 MPa which was less than the ultimate tensile strength of the material; hence, no surface cracks were observed at any of the machining conditions. Though surface cracks were not observed, higher values of residual stresses and surface roughness were not preferred for long service life and for good surface integrity. The lower side of residual stress values in aluminum 2014 T6 alloy when compared to hard metals revealed the scope for further reduction of residual stresses in machining of various other materials.
References
- [1] S.S. Baraskar, S.S. Banwait, S.C. Laroiya; Multiobjective optimization of electrical discharge machining process using a hybrid method; Mater. Manuf. Proc., 28 (2013), pp. 348–354
- [2] J.B. Saedon, N. Jaafar, R. Jaafar, N. Saad, M.S. Kasim; Modeling and multi-response optimization on WEDM Ti6Al4V; Appl. Mech. Mater., 510 (2014), pp. 123–129
- [3] V.G. Navas, I. Ferreres, J.A. Maranon, C.G. Rosales, G. Sevillano; Electro discharge machining (EDM) versus hard turning and grinding-comparison of residual stresses and surface integrity generated in AISI 01 tool steel; J. Mater. Process. Technol., 195 (2008), pp. 186–194
- [4] F. Ghanem, N.B. Fredj, H. Sidhom, C. Braham; Effects of finishing processes on the fatigue life improvements of electro-machined surfaces of tool steel; Int. J. Adv. Manuf. Technol., 52 (2011), pp. 583–595
- [5] E. Capello; Residual stresses in turning: Part I: Influence of process parameters; J. Mater. Process. Technol., 160 (2) (2004), pp. 221–228
- [6] K. Bonny, P. De Baets, J. Quintelier, J. Vleugels, D. Jiang, O. Van der Biest, B. Lauwers, W. Liu; Surface finishing: impact on tribological characteristics of WC–Co hardmetals; Tribology. Int., 43 (2010), pp. 40–54
- [7] H. Sidhom, F. Ghanem, T. Amadou, G. Gonzalez, C. Braham; Effect of electro discharge machining (EDM) on the AISI316L SS white layer microstructure and corrosion resistance; Int. J. Adv. Manuf. Technol., 65 (2013), pp. 141–153
- [8] S.L. Soo, M.T. Antar, D.K. Aspinwall, C. Sage, M. Cuttell, R. Perez, A.J. Winn; The effect of wire electrical discharge machining on the fatigue life of Ti–6Al–2Sn–4Zr–6Mo aerospace alloy; Proc. CIRP, 6 (2013), pp. 216–220
- [9] B. Ekmekci; Residual stresses and white layer in electrical discharge machining (EDM); Appl. Surf. Sci., 253 (2007), pp. 9234–9240
- [10] B. Ekmekci, A.E. Tekkaya, A. Erden; A semi empirical approach for residual stresses in electrical discharge machining (EDM); Int. J. Adv. Mach. Tools. Manuf., 46 (7–8) (2006), pp. 858–868
- [11] F. Ghanem, C. Braham, H. Sidhom; Influence of steel type on electrical discharge machined surface integrity; J. Mater. Process. Technol., 142 (1) (2003), pp. 163–173
- [12] J.P. Kruth, P. Bleys; Measuring residual stresses caused by wire EDM of tool steel; Int. J. Electrical Mach., 5 (1) (2000), pp. 23–28
- [13] A.G. Mamalis, N.M. Vosniakos, N.M. Vacevanidis, X. Junzhe; Residual stress distribution and structural phenomena of high-strength steel surfaces due to EDM and ball-drop forming; CIRP Annu., 37 (1) (1998), pp. 531–535
- [14] T.R. Newton, S.N. Melkote, T.R. Watkins, R.M. Trejo, L. Reister; Investigation of the effect of process parameters on the formation and characteristics of recast layer in wire-EDM of Inconel 718; Mater. Sci. Eng., 513 (2009), pp. 208–215
- [15] G.N. Levy, F. Maggi; WED machinability comparison of different steel grades; Ann. CIRP, 39 (1) (1990), pp. 183–185
- [16] A.A. Khan; Electrode wear and material removal rate during EDM of aluminum and mild steel using copper and brass electrodes; Int. J. Adv. Manf. Technol., 39 (5–6) (2008), pp. 482–487
- [17] F. Klocke, M. Zeis, A. Klink, D. Veselovac; Technological and economical comparison of roughing strategies via milling, sinking-EDM, wire-EDM and ECM for titanium- and nickel-based blisks; CIRP J. Manuf. Sci. Technol., 6 (2013), pp. 198–203
- [18] G. Selvakumar, G. Sornalatha, S. Sarkar, S. Mitra; Experimental investigation and multi-objective optimization of wire electrical discharge machining (WEDM) of 5083 aluminum alloy; Trans. Nonferrous Met. Soc. China, 24 (2014), pp. 373–379
- [19] S. Arooj, M. Shah, S. Sadiq, S.H.I. Jaffery, S. Khushnood; Effect of current in the EDM machining of aluminum 6061 T6 and its effect on the surface morphology; Arab. J. Sci. Eng., 39 (2014), pp. 4187–4199
- [20] P.S. Rao, K. Ramji, B. Satyanarayana; Experimental investigation and optimization of wire EDM parameters for surface roughness, MRR and White Layer in machining of aluminium alloy; Proc. Mater. Sci., 5 (2014), pp. 2197–2206
- [21] R.L. Mason, R.F. Gunt, J.L. Hess; Statistical Design and Analysis of Experiments; Wiley, New York (2003)
- [22] I. Ogata, Y. Mukoyama; Residual stress on surface machined by wire electric discharge; Int. J. Jpn. Soc. Prec. Eng., 25 (4) (1991), pp. 273–278
- [23] J. Lu; Handbook of Measurement of Residual Stresses; The Fairmont Press Inc. (1996)
- [24] F. Nourbakhsha, K.P. Rajurkarb, A.P. Malshec, J. Cao; Wire electro-discharge machining of titanium alloy; Proc. CIRP, 5 (2013), pp. 13–18
- [25] B. Ravindranadh, V. Madhu, A.K. Gogia; Effect of wire-EDM machining parameters on surface roughness and material removal rate of high strength armor steel; Mate. Manuf. Proc., 28 (2013), pp. 364–368
- [26] M.J. Haddad, A.F. Tehrani; Material removal rate study in the cylindrical wire electrical discharge turning (CWEDT) Process; J. Mater. Process. Technol., 199 (2008), pp. 369–378
- [27] H. Ahmet, U. Caydas; Experimental study of wire electrical discharge machining of AISI D5 tool steel; J. Mater. Process. Technol., 148 (2004), pp. 362–367
- [28] K.M. Patel, M. Pulak, P. Pandey, P.V. Rao; Surface integrity and removal mechanisms associated with the EDM of Al2O3 ceramic composite; Int. J. Refractory. Metals. Hard. Mater., 27 (5) (2009), pp. 892–899
- [29] S. Sarkar, S. Mitra, B. Bhattacharyya; Parametric optimization of wire electrical discharge machining of γ titanium aluminide alloy; J. Mater. Process. Technol., 159 (2005), pp. 286–294
- [30] Y.P. Trykov, O.V. Slautin, V.N. Arisova, V.G. Shmorgun, I.A. Pomomareva; Effect of technological factors on the diffusion kinetics in the copper–aluminum composite; Russian J. Non-Ferrous. Metals, 49 (2008), pp. 42–48
- [31] E.B. Pismenskaya, A.S. Rogachev, D.Y. Kovalev, V.I. Ponomarev; The mechanism of formation of copper aluminide in the thermal explosion mode; Russ. Chem. Bull., 49 (2000), pp. 1954–1959
- [32] A. Kumar, V. Kumar, J. Kumar; Surface integrity and material transfer investigation of pure titanium for rough cut surface after wire electro discharge machining; J. Eng. Manuf., 228 (2014), pp. 880–901
- [33] R.E. Williams, K.P. Rajurkar; Study of wire electrical discharge machined surface characteristics; J. Mater. Process. Technol., 28 (1991), pp. 127–138
- [34] J.T. Huang, Y.S. Liao, W.J. Hsue; Determination of finish cutting operation number and machining parameters setting in wire electrical discharge machining; J. Mater. Process. Technol., 87 (1999), pp. 69–81
- [35] T.Y. Tai, S.J. Lu; Improving fatigue life of electro-discharge-machined SKD11 tool steel via the suppression of surface cracks; Int. J. Fatigue, 31 (2009), pp. 433–438
- [36] B. Izquierdoa, S. Plazab, J.A. Sanchezb, I. Pomboc, N. Ortegab; Numerical prediction of heat affected layer in the EDM of aeronautical alloys; App. Surf. Sci., 259 (2012), pp. 780–790
- [37] M.M. Dhobe, I.K. Chopde, C.L. Gogte; Investigations on surface characteristics of heat treated tool steel after wire electro-discharge machining; Mater. Manuf. Proc., 28 (2013), pp. 1143–1146
- [38] J.C. Rebelo, A.M. Dias, D. Kremer, J.L. Lebrun; Influence of EDM pulse energy on the surface integrity of martensitic stells; J. Mater. Process. Technol., 84 (1998), pp. 90–96
Document information
Published on 12/04/17
Licence: Other
Share this document
Keywords
claim authorship
Are you one of the authors of this document?
