Abstract
The characteristics of haze days and the climatic background are analyzed by using daily observations of haze, precipitation, mean and maximum wind speed of 664 meteorological stations for the period of 1961–2012. The results show that haze days occur significantly more often in eastern China than in western China. The annual number of haze days is 5–30 d in most parts of central-eastern China, with some areas experiencing more than 30 d, while less than 5 d are averagely occurring in western China. Haze days are mainly concentrated in the winter half-year, with most in winter, followed by autumn, spring, and then summer. Nearly 20% of annual haze days are experienced in December. The haze days in central-eastern China in the winter half-year have a significant increasing trend of 1.7 d per decade during 1961–2012. There were great increases in haze days in the 1960s, 1970s and the beginning of the 21st century. There was also significant abrupt changes of haze days in the early 1970s and 2000s. From 1961 to 2012, haze days in the winter half-year increased in South China, the middle-lower reaches of the Yangtze River, and North China, but decreased in Northeast China, eastern Northwest China and eastern Southwest China. The number of persistent haze is rising. The Longer the haze, the greater the proportion to the number persistent haze. Certain climatic conditions exacerbated the occurrence of haze. The correlation coefficient between haze days and precipitation days in the winter half-year is mainly negative in central-eastern China. The precipitation days show a decreasing trend in most parts of China, with a rate of around –4.0 d per decade in central-eastern China, which reduces the sedimentation capacity of atmospheric pollutants. During the period of 1961–2012, the correlation coefficients between haze days and mean wind speed and strong wind days are mainly negative in central-eastern China, while there exists positive correlation between haze days and breeze days in the winter half-year. The mean wind speed and strong wind days are decreasing, while breeze days are increasing in most parts of China, which is benefitial to the reduction of the pollutants diffusion capacity. As a result, haze occurs more easily.
Keywords
haze ; winter half-year ; precipitation days ; wind speed
1. Introduction
Haze is a weather phenomena affecting the visibility of lower atmosphere, which is caused by a large number of very fine dry dust evenly floating in the air and resulting in a horizontal visibility below 10 km at common air turbidity [ CMA , 2003 ]. In the case of haze, the fine particles are difficult to diffuse due to stable atmospheric stratification leading to a serious threat to people’s health [ Bai et al. , 2006 ]. Many scholars have studied the composition and climate characteristics of haze in the past. Malm [1992] found that the low visibility in haze over the U.S. was mainly caused by sulfate aerosols, while Schichtel et al. [2001] analyzed the haze trend in the U.S. during 1980–1995 and found that haze days have reduced by about 10% since the implementation of the Clean Air Act, and this decline is synchronous with the SO2 emissions. In recent years, with the rapid urbanization and economic development in China, increases in air pollutants and haze have become severe weather events. Domestic studies show that, the middle and lower reaches of the Yangtze River, North China, and South China have become haze-prone areas and the annual haze days in China had increased significantly from 1961 to 2005 [ Gao, 2008 and Hu and Zhou, 2009 ]. After the 1980s, haze days obviously increased, and occurred often in winter. The total haze days in December and January accounted for 30% of the whole year [ Wu et al. , 2010 ]. The increase of haze days is not only closely related to the concentration of air pollutants [ Tong et al. , 2007 ], but also to the meteorological conditions at the surface. In addition, wind speed, relative humidity and the concentration of PM2.5 (particles smaller than 2.5 μ m) play major role in the formation of haze [ Hu et al. , 2009 ]. Additionally, the zonal circulation is closely related to the frequency of haze in the Pearl River Delta [ Wu et al. , 2008 ].
In summary, Chinese scholars have carried out studies on climate characteristics and variations in haze, but only few focused on the relationship between large-scale climate change and haze. In this paper, the latest observational data is used to systematically analyze the temporal variation of haze days in the winter half-year during 1961–2012, and to explore the change characteristics of climatic background affecting haze from a climate change perspective.
2. Materials and methods
The haze data are taken from the Dataset of Haze Days in China provided by the national meteorological data storage and retrieval system of the National Meteorological Information Center. This dataset draws up daily haze observations based on the criteria of the weather phenomenon, but not by revising relative humidity. Data is also taken from observations at meteorological stations with complete records for at least 30 years for the period 1961–2012. In China, 664 stations are available with such records. In order to identify the causes of changes in haze days, daily precipitation, mean and maximum wind speed from the above stations are also used.
The least square method is used for linear regression, and the sliding T method [ Afifi and Azen , 1972 ] is used to test whether there is a mean mutation in the sequence. The latter method is artificial in its selection of the sub-sequence length and may cause a drifting mutation. The M-K test [ Goossens and Berger , 1986 ] is used for the significance testing of the linear trends.
3. Climatic changes of haze days
3.1. Climatic distribution of haze days
For the period 1981–2010, the annual haze days show a spatial decrease from east to west (Figure omitted). In the west, annual haze days less than 5 d are observed in most areas, and even less in the northeast and the middle-east of Inner Mongolia. Annual haze days of 5–30 d are observed in North China, the middle and lower reaches of the Yangtze River, and South China. Haze days more than 30 d occur in the middle of Guangdong, northeastern Guangxi, northern Jiangxi, northern Zhejiang, southern Jiangsu, central Henan, and southern Shanxi, which is consistent with other studies [ Gao, 2008 and Hu and Zhou, 2009 ].
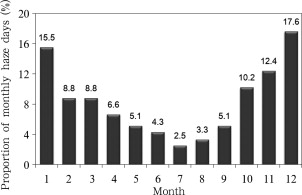
The above analysis showed that haze mainly occurs in central-eastern China (east of 100°E and south of 42°N), with most in winter, accounting for 41.9% of annual haze days, followed by autumn (27.7%), spring (20.5%), and summer (10.1%) (Fig. 1 ). On monthly basis, haze most frequently occurs in December in central-eastern China, accounting for 17.6% of all annual haze days, followed by January (15.5%), but with the least frequency in July (only 2.5%).
|
|
|
Figure 1. Proportion of monthly haze days in central-eastern China (1981–2010 mean) |
3.2. Climatic change in haze days
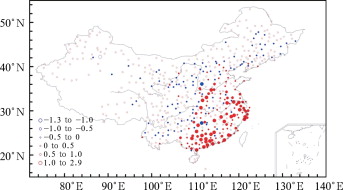
The above analysis showed that haze days mainly occur in the winter half-year (October to March) in China. Haze days in the winter half-year in central-eastern China show an increasing trend for the period of 1961–2012, particularly high increases are found in central-northern South China and the lower reaches of the Yangtze River, while decreases are apparent in Northeast China, the eastern parts of Northwest China and of Southwest China (Fig. 2 ). In central South China and the lower reaches of the Yangtze River, the average increase in haze days is more than 1 d per year. The increasing trends of most stations in North China, the middle and lower reaches of the Yangtze River, and South China are significant at the 95% confidence level, while only few show a significant decrease in Northeast China, eastern Northwest China, and Southwest China.
|
|
|
Figure 2. Spatial distribution of linear trends in haze days (unit: d per year) during the winter half-year in China from 1961 to 2012 (solid dot represents a significance at the 95% confidence level) |
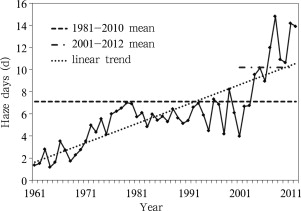
In 1961–2012, central-eastern China shows significant increasing trends in average haze days in the winter half-year, with the rate of 1.7 d per decade (Fig. 3 ). Furthermore, there is an obvious interdecadal change in haze days. From the 1960s to the mid-1970s, the number of haze days is less than the average, but with an obvious increase. From the late 1970s to the 1990s, the number of haze days fluctuates slightly lower than the average; but since 2001, haze days increase significantly with an average number of 10.2 d (3.1 d more than average). The increase in haze days from the 1960s to the 1980s is consistent with the increase in the aerosol optical depth [ Luo et al. , 2001 ] for the same period, which may also be related to the changes in observation methods.
|
|
|
Figure 3. Variations of haze days during the winter halfyear averaged for central-eastern China from 1961 to 2012 |
After testing the subsequence of haze days in the winter half-year of central-eastern China, Southwest China, South China, the middle and lower reaches of the Yangtze River, North China, and Northeast China, the haze days in most areas showed two abrupt changes in the 1970s and the early 2000s, as well as a more change in the 1980s in Southwest and North China, but only one change in Northeast China. The trend test shows that there is tendency mutation (increasing trend of slowing) in haze days in central-eastern China from the late 1970s to the early 1980s, which is not significant at the 95% confidence level.
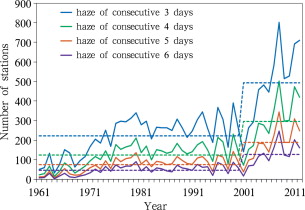
In the beginning of the 21st century, the number of persistent haze in central-eastern China in the winter half-year increases significantly (Fig. 4 ). During the period 1961–2000, the number of persistent haze for consecutive 3 days has increased from 222 to 493; the number of persistent haze for consecutive 4 days has increased from 124 to 296; the number of persistent haze for consecutive 5 days has increased from 75 to 188; the number of persistent haze for consecutive 6 days has increased from 47 to 127. They are 2.2, 2.4, 2.6 and 2.7 times respectively of the 1961–2000 means. It indicates that in the early 21st century, the number of haze days increases, and the persistent haze is also increasing.
|
|
|
Figure 4. The number of persistent haze events in the winter half-year during 1961–2012 in central-eastern China |
4. The climatic causes of changes in haze days
There are two preconditions for the occurrence of haze: at first large number of pollutants exist in the air, and secondly a stable atmospheric stratification and minor wind speed are apparent. When the air contains many pollutants and the atmospheric stratification is stable, the pollutants cannot be dispersed in time, then haze appears.
Main sources of air pollutants include ground dust, automobile exhaust, industrial exhaust and heating exhaust in winter [ Zhang et al., 2010 , Song et al., 2012 and Gao et al., 2012 ]. From the 1980s, Chinese economy has developed fast and the urbanization progress has been accelerated, which mainly increases industrial exhaust. Meanwhile, the number of automobiles increased rapidly. For example, car ownership in Beijing in 2012 was 2.6 times of that in 2001. The increase in automobiles possession and traffic jams further worsen the amount of pollutants from automobile exhaust. All these are important reasons for the increase in haze days in the last decade in central-eastern China. Furthermore, the climatic conditions, which hinder the diffusion of pollutants, will aggravate haze disaster.
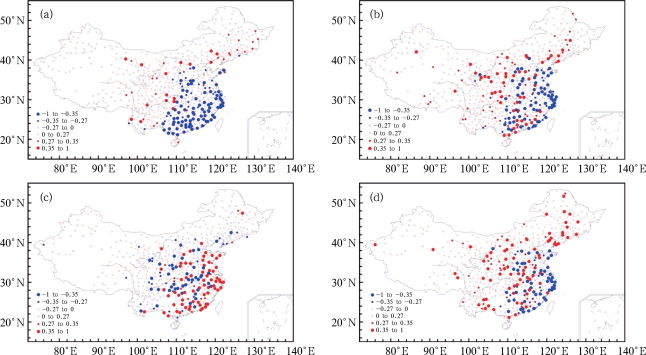
According to the linear tendency of precipitation days in the winter half-year from 1961 to 2012 obtained from nationwide stations, the number of precipitation days of all regions reduced with the exception of southern Xinjiang. Precipitation days reduced at 0.2–1.0 d per year in most areas of central-eastern China and more than 1 d per year in the southwestern Yunnan province (Figure omitted). When precipitation days reduce, the scouring action of rainfall on air pollutants will weaken and pollutant particles will sustain in the air for a longer time. In this case, haze will probably appear. The average number of precipitation days in central-eastern China reduced greatly (–4.0 d per decade). A significant negative correlation (–0.71) between haze days and precipitation days was observed. According to the correlation coefficient between haze days and precipitation days in the winter half-year obtained from all stations (Fig. 5 a), Huanghuai region, the middle and lower reaches of the Yangtze River, and South China, which observe more haze days, show significant negative correlation.
|
|
|
Figure 5. Spatial distribution of correlation coefficients between haze days and precipitation days (a), and mean wind speed (b), and breeze days (c), and strong wind days (d) in the winter half-year during 1961–2012 in China (the solid dot represents a significant trend at the 95% confidence level) |
Wind speed might reflect the change in atmospheric stability, and indirectly show the self-cleaning capability of air. From the aspect of dynamic conditions, wind transports local pollutants to other areas or heights to fully blend with the air and finally dilutes the pollutants and so that the air quality is improved. The mean wind speed in most regions of China in winter reduced at the rate of –0.5 to –0.1 m s–1 per decade, with some regions lower than –0.5 m s–1 per decade (Figure omitted). The number of haze days averaged in central-eastern China in winter have significant negative correlation (–0.68) with the mean wind speed. According to the correlation coefficients between haze days and mean wind speed across all stations (Fig. 5 b), significant negative correlation is found in the Huanghuai region, and the middle and lower reaches of the Yangtze River, while there are positive correlations in Northeast China, eastern Northwest China, and most areas of Guangdong province.
The strong wind days (maximum wind speed ≥ 10 m s–1 ) and breeze days (maximum wind speed≤3 m s–1 ) may indicate atmospheric stability to some extent. From 1961 to 2012, strong wind days and breeze days in the winter half-year show an opposite tendency. In other words, strong wind days reduce, while breeze days increase (Figure omitted). The reduction rate of strong wind days in North China, normally above 10 d per decade, is higher than that in South China (merely below 5 d per decade). On the other hand, breeze days increase dramatically (10 d per decade) in the Yangtze River regions, but without great increases in the northeast, north, and south of China (0–10 d per decade). The correlation coefficient between haze days and strong wind days averaged in central-eastern China in winter half-year is –0.79, while that between haze days and breeze days is 0.67. These two coefficients are significant at the 99% confidence level. In most stations in central-eastern China, haze days show positive correlation with breeze days, but negative correlation with strong wind days in the winter half-year. Some of these correlation coefficients are significant at the 95% confidence level (Fig. 5 c & 5 d).
5. Conclusions and discussion
(1) The results show that more haze days significantly occur in eastern China than in western China. The annual number of haze days ranges at 5–30 d in most areas of central-eastern China, with some areas more than 30 d, while less than 5 d are observed in western China. Haze days are mainly concentrated in the winter half-year, and most haze days occur in winter, followed by autumn and spring, with the least in summer. Monthly haze days in December are the most, with nearly 20% of the annual haze days.
(2) Haze days in the winter half-year averaged in central-eastern China have a significant increasing trend of 1.7 d per decade for the period 1961–2012. Sharp increases in haze days occurred in the 1960s, the 1970s, and the beginning of the 21st century. There was a remarkable abrupt change of haze days in the early 1970s and the beginning of the 21st century. From 1961 to 2012, haze days in winter half-year increased in South China, the middle-lower reaches of the Yangtze River and North China, but decreased in Northeast China, eastern Northwest China and eastern Southwest China. Long persistent haze events increased more significantly than the short ones.
(3) Unfavorable climatic conditions exacerbated the occurrence of haze. The correlation coefficient between haze days and precipitation days in winter halfyear is mainly negative in central-eastern China. The number of precipitation days shows a decreasing trend in most regions of China, with rates of around –4 d per decade in central-eastern China, which reduces the sedimentation capacity of atmospheric pollutants. During the period of 1961–2012, the correlation coefficients between haze days and mean wind speed and strong wind days are mainly negative in central-eastern China, but that between haze days and breeze days is positive in the winter half-year. The mean wind speed and strong wind days reduced, while breeze days increased in most regions of China, which leads to a reduction of the pollutants diffusion capacity. As a result, haze occurs more frequently.
This paper preliminarily discussed changes in haze days in China and the causes from the perspective of climate conditions. To make a systematic analysis on causes of haze, we need further research on the changes in haze observations, which means the impact of the meteorological station migration, the progress of urbanization, the changes in industrial exhaust sources, the number of automotive vehicles, and traffic jams. Haze have great impacts on the society in recent years, so it is helpful to prevent and control haze more effectively by strengthening our understanding of the causes of haze.
Acknowledgements
The authors are very grateful to the anonymous reviewers and editors for their constructive comments and suggestions. The study was supported by the National Basic Research Program of China (No. 2012CB955902).
References
- Afifi and Azen, 1972 A.A. Afifi, S.P. Azen; Statistical Analysis: A Computer Oriented Approach, Academic Press (1972), p. 366
- Bai et al., 2006 Z.-P. Bai, B.-B. Cai, H.-Y. Dong, et al.; Adverse health effects caused by dust haze: A review; Environmental Pollution and Control (in Chinese), 28 (3) (2006), pp. 198–200
- CMA (China Meteorological Administration), 2003 CMA (China Meteorological Administration; The Standard of Surface Meteorological Observation (in Chinese), China Meteorological Press (2003), p. 23
- Gao, 2008 G. Gao; The climatic characteristics and change of haze days over China during 1961–2005; Acta Geographica Sinica, 63 (7) (2008), pp. 761–768
- Gao et al., 2012 J. Gao, Y.-Z. Zhang, S.-L. Wang, et al.; Study on the characteristics and formation of a multi-day haze in October 2011 in Beijing; Research of Environmental Sciences (in Chinese), 25 (11) (2012), pp. 1201–1207
- Goossens and Berger, 1986 C.H. Goossens, A. Berger; Annual and seasonal climatic variations over the Northern Hemisphere and Europe during the last century; Ann. Geophys., 4 (1986), pp. 385–400
- Hu et al., 2009 R.-Z. Hu, H.-N. Liu, M.-G. Zhang, et al.; Simulation of brownish haze in urban areas of Nanjing; Acta Scientiae Circum Stantiae (in Chinese), 29 (4) (2009), pp. 808–814
- Hu and Zhou, 2009 Y.-D. Hu, Z.-J. Zhou; Climatic characteristics of haze in China; Meteorological Monthly (in Chinese), 35 (7) (2009), pp. 73–78
- Luo et al., 2001 Y.-F. Luo, D.-R. Lu, X.-J. Zhou, et al.; Characteristics of the spatial distribution and yearly variation of aerosoloptical depth over China in last 30 years; J. Geophys. Res., 106 (D13) (2001), pp. 14501–14513
- Malm, 1992 W.C. Malm; Characteristics and origins of haze in the continental United States; Earth-Science Reviews, 33 (1) (1992), pp. 1–36
- Schichtel et al., 2001 B.A. Schichtel, R.B. Husar, S.R. Falke, et al.; Haze trends over the United States, 1980–1995; Atmospheric Environment, 35 (11) (2001), pp. 5205–5210
- Song et al., 2012 J. Song, T. Cheng, Z.-Q. Xie, et al.; Impact on spatio-temporal variation of fog and haze days due to rapid urbanization in Jiangsu; Journal of the Meteorological Science (in Chinese), 32 (3) (2012), pp. 275–281
- Tong et al., 2007 R.-Q. Tong, Y. Yin, L. Qian, et al.; Analysis of the characteristics of hazy phenomena in Nanjing area; China Environmental Science (in Chinese), 27 (5) (2007), pp. 584–588
- Wu et al., 2008 D. Wu, G.-L. Liao, X.-J. Deng, et al.; Transport condition of surface layer under haze weather over the pearl river delta; Journal of Applied Meteorological Science (in Chinese), 19 (1) (2008), pp. 1–9
- Wu et al., 2010 D. Wu, X.-J. Wu, F. Li, et al.; Temporal and spatial variation of haze during 1951–2009 in Chinese mainland; Acta Meteorologica Sinica (in Chinese), 68 (5) (2010), pp. 680–688
- Zhang et al., 2010 H. Zhang, C.-E. Shi, M.-Y. Qiu, et al.; Longterm variation of haze phenomena in Hefei and its impact factors; Acta Scientiae Circum Stantiae (in Chinese), 30 (4) (2010), pp. 714–721
Document information
Published on 15/05/17
Submitted on 15/05/17
Licence: Other
Share this document
Keywords
claim authorship
Are you one of the authors of this document?
