(Created page with "==On the Arc Length Method: Combining Ideas and Implementations Aspects== '''N. M. Lafontaine<math>^1</math>, X. R. Wang<math>^2</math>, K.F. Huang<math>^2</math>, M. W. Yua...") |
|||
| (3 intermediate revisions by 2 users not shown) | |||
| Line 1: | Line 1: | ||
| − | |||
| − | |||
| − | |||
| − | |||
| − | |||
| − | |||
| − | |||
| − | |||
| − | |||
| − | |||
| − | |||
| − | |||
| − | |||
| − | |||
| − | |||
| − | |||
| − | |||
| − | |||
| − | |||
| − | |||
| − | |||
| − | |||
| − | |||
| − | |||
| − | |||
| − | |||
| − | |||
| − | |||
| − | |||
==1 Introduction== | ==1 Introduction== | ||
| Line 390: | Line 361: | ||
<span style="text-align: center; font-size: 75%;">([[#fnc-1|<sup>1</sup>]]) By author's experiences, it necessary to take care about computer precision, due to sometimes the value of the quantities in quadratic equations are really small and can be lost significant digits.</span> | <span style="text-align: center; font-size: 75%;">([[#fnc-1|<sup>1</sup>]]) By author's experiences, it necessary to take care about computer precision, due to sometimes the value of the quantities in quadratic equations are really small and can be lost significant digits.</span> | ||
| − | ===4.2 Method 2. Elimination of < | + | ===4.2 Method 2. Elimination of r<sup>⊥</sup>=== |
Generally the quadratic equation [[#eq-25|25]] solved for <math display="inline">\eta _i</math> gives real roots. Since it is not possible to find a real roots to give the chosen arc length, Lam and Morley (1992) suggested that the main problem is that the orthogonal error <math display="inline">\boldsymbol {r}^{\perp }</math> is too large. In case that Eqn [[#eq-25|25]] leads to complex values, the follow procedure proposed by Lam and Morley (1992) is adopted <span id='citeF-4'></span>[[#cite-4|[4]]]. | Generally the quadratic equation [[#eq-25|25]] solved for <math display="inline">\eta _i</math> gives real roots. Since it is not possible to find a real roots to give the chosen arc length, Lam and Morley (1992) suggested that the main problem is that the orthogonal error <math display="inline">\boldsymbol {r}^{\perp }</math> is too large. In case that Eqn [[#eq-25|25]] leads to complex values, the follow procedure proposed by Lam and Morley (1992) is adopted <span id='citeF-4'></span>[[#cite-4|[4]]]. | ||
| Line 660: | Line 631: | ||
A basic arc length algorithm implemented in NOLM program is summarized in the following box depicted in [[#6.1 Summary Arc Length Algorithm Procedure|6.1]]. This algorithm correspond to the spherical arc-length method, however, with small change in the code, a cylindrical arc-length procedure can also be used . | A basic arc length algorithm implemented in NOLM program is summarized in the following box depicted in [[#6.1 Summary Arc Length Algorithm Procedure|6.1]]. This algorithm correspond to the spherical arc-length method, however, with small change in the code, a cylindrical arc-length procedure can also be used . | ||
| − | |||
| − | |||
<span style="text-align: center; font-size: 75%;"> Arc length scheme. | <span style="text-align: center; font-size: 75%;"> Arc length scheme. | ||
Latest revision as of 13:55, 20 March 2018
1 Introduction
In non linear finite element analysis, traditional incremental or iterative method like the standard Newton-Raphson method (NR) is widely used to trace the right equilibrium path for nonlinear problems due to large geometry change and/or material behaviour. Common examples appear in softening and buckling instability problems involving snap-through or snap-back phenomena. Typical equilibrium paths associated with snap-through and snap-back behavior are illustrated in Figure 1 where appears the critical points , , , and commonly categorized into limit points and into bifurcation points respectively. However, a further disadvantage of the NR method is that without some addition of special techniques a falling load path cannot be handled and hence no convergence at specific locations along the trajectories of load-deflection is reached. In other words, in such situations, the standard load-controlled NR method in which incremental displacement vector is calculated by a prescribed incremental load factor lead to error near the peak point ( see point and of Figure 1). To overcome these kinds of difficulties, often, the NR method is accompanied with some load or displacement controlled strategy and a line searches methods. However, is well known that similar failures happens when equilibrium paths encounter the limit point of snap-back (see points and of Figure 1).
![snap-back and snap through response [7].](/wd/images/thumb/9/9d/Draft_Samper_836349612-fig_1a.png/600px-Draft_Samper_836349612-fig_1a.png)
|
| Figure 1: snap-back and snap through response [7]. |
To overcome such problems, methods and techniques of switching between load and displacement controls (Sabir and Lock, 1972), of using the artificial springs (Wright and Gaylord, 1968), of abandoning the equilibrium iterations in the close vicinity of the limit point (Bergan and Soreide, 1978; Bergan et al., 1978), or of allowing load reductions within load control (Cope and Rao, 1981; Bergan and Holand, 1979; Crisfield, 1982; Phillips and Zienkiewicz, 1976) have been successively proposed. However, these methods and techniques usually require great care and cannot always give satisfactory results. Ramm (1981) reviewed all the available methods and suggested the most versatile is the arc-length method which was originally developed by Riks (1972, 1979) and Wempner (1971) and later modified and widely used by Ramm (1981) and Crisfield (1981,1982a, 1983,1984)[1]. After that more and more attentions (Crisfield, 1986; Lam and Morley, 1992) were paid to improve and apply this method.
The AL method is the most powerful path following method in the solution of equilibrium paths, bifurcation points and limit points by introducing a constraint condition which establishes the nonlinear equations in which the unknown load parameter is determined[2]. The AL method has been accepted as the most effective numerical method for the post-buckling problems with NR method type algorithms. For such situations the AL method is useful to avoid bifurcation points and track unloading. The AL method method causes the Newton-Raphson equilibrium iterations to converge along an arc, as can be seen in Figure 2, thereby often preventing divergence, even when the slope of the load vs. deflection curve becomes zero or negative. The constraint equation is forced to be satisfied at each iteration.
In this dissertation we described the basic aspect of the AL method and integrated ideas to improve the standard AL method . This combinations are based on the Crisfield arc-length method, but in this case using a spherical arc length and the strategies developed by [1] to avoid complex roots. For analysis of softening material, an isotropic damage model is introduced with the objective energy mesh dissipation. Benchmarking examples are tested for proving the implemented algorithm.
2 Basic formulation of Arc-Length solution procedure
The Arc-Length method is described within the category of continuation methods and it is applied to obtain solution paths[3]. In the non-linear finite element analysis, the system of non-linear algebraic equations to be solve take the form:
|
|
(1) |
where is a function of the displacement vector and the load parameter , and is the out-of-balance force vector which vanishes at equilibrium. The internal force vector is a function of the displacements and is the prescribed external force vector and is scaled by the load intensity parameter . Hence represents the load applied at the current load increment. Basically, the arc-length method first consider the load factor in Eq.1, as a variable in the residual equation. Then, an extra new constraint equation is added to the residual equilibrium equation for defining unequivocally the next equilibrium point solution at an intersection between the solution path and the constrains equation. This representation enables introducing as an additional "degree-of-freedom", thereby expanding the dimensions of the solution space by one, for tracing the snap-through and snap-back behaviour of the curves of load against displacements. This constrains equation can be written in differential form
|
|
(2) |
or increment form as
|
|
(3) |
where is vector of incremental displacement, is specified external load vector, is incremental load-factor, is fixed radius of desired intersection, and is the scaling parameter. In load-displacement space, it is designed to search the solution of the next iteration on a small ellipsoidal surface surrounding the last converged point, of size determined by the prescribed arc length . Another constraint equations can also be found in the literature, e.g, Bathe and Dvorkin (1983).
Assuming that displacement increments satisfying constraint Eq 3, is possible to obtain a simplified linearized version of this constraint equation adopting the idea of Riks and Wempner(1971) for the iteration, i.e
|
|
(4) |
where and are the required corrections to and respectively. This results in this so called fixed normal plane constraint, with the solution iterates all lying on the hyperplane normal to the tangent at last converged point in load-displacement space[1]. However, the Risk and Wempner method was not suitable for standard finite element analysis even with modified Newton-Raphson (mN-R) procedure, because equations proposed by Riks destroy the banded nature of the stiffness matrix [4].
Therefore, we can directly used a matrix form (Crisfield 1991), that with some simplifications in Eq 1 and 3, we compute the iterative change in displacement vector and load-factor in the iteration,
|
|
(8) |
where we define the effective general matrix of dimension
|
|
(10) |
where is the tangential stiffness matrix, and and are the previous values of out-of-balance load vector and arc-length. Note that is a non-symmetric matrix. However, as Crisfield (1981) stated, the direct full assembling and solving of this matrix reduces the solution efficiency, since the symmetric banded nature of the system stiffness matrix can no longer be exploited. After the iterative change and have been computed, the displacement vector and load-factor are updated, i.e
|
Alternatively, instead of solving directly Eq 8, constraint equation can be introduced by following the technique of Baltoz and Dhatt (1979) for displacement control at single point. Ramm (1981) and Crisfield (1981, 1982, 1983, 1984) applying this technique, gave the modification of the method and introduced an indirect solution scheme for the constraint equation 3. According to this technique, the iterative change of displacement for the new unknown load level is written as [4]
|
where is the displacement vector resulting from eliminating the out-of-balance forces and is the parallel displacement vector computed and stored after every update of the stiffness matrix . Substituting values from 11 and 14 into the constraint equation yields in a quadratic equations in so that
|
|
(15) |
where
|
This method is graphically shown in 2. Note that the parameter convert everything to the same dimension and order of magnitude. Many analyst set this . This procedure is known as the indirect spherical AL method Crisfield(1891). A typical value for is taken as [1]. Eq.15 is solved to get the value of , and so to define the iterative change completely. This equation leads to two results of . Despite the sophistication of the arc-length procedure of Ramm and Crisfield certain difficulties remain in its applications. The first concerns to the choice of proper roots for the quadratic equations, which the method for selection of proper value will be discussed in subsequent sections; and secondly, complex roots of a quadratic equations something occurs and the reason are not clear yet, but is strongly related to the arc-length chosen.
![Arc-length procedure for specific iteration [8].](/wd/images/thumb/2/22/Draft_Samper_836349612-fig_2.png/600px-Draft_Samper_836349612-fig_2.png)
|
| Figure 2: Arc-length procedure for specific iteration [8]. |
3 Modify arc-length procedure
Lam and Morley suggested decomposing the out-of-balance load into a parallel component , which is in the specified applied load direction; and orthogonal component , with respect to fixed nodal load vector in case of divergence, where
|
In the equations above the, is the orthogonal operator introduce by convenience. In its work, they proposed a new strategy to deal with the complex roots arising from the solution of the quadratic equation, which will be be discussing later. Given the and the , and have the formation represented as
|
and
|
|
(20) |
where was introduced a scaling parameter in Eqn 19.a which will be discussing later. Substituting Eqns 20 and 19.b into the constraint equations 3, gives a new quadratic equations in , similar to Eqn 15 written as
|
|
(21) |
where, in this case
|
This procedure becomes general arc-length procedure proposed by Crisfield when , and . Thus far, the basic formulation of arc-length solution procedure is completed. However, during calculation of practical problem, there still are certain difficulties remain in application of arc-length method. The main problem is that quadratic equation 21 sometimes has complex roots that cause failure of convergence. Methods to solve this problem are discussed in the next part. Even we can found in the literature that is possible to get the correct answer of without resolving any quadratic equations and avoiding the trace-back solution path when a wrong solution of is found and choose.
4 Adjustment for complex roots
As we commented before, the main problem arises in this arc length procedure came from the complex solution obtained by the solutions of the quadratic equations 21. Particularly, we get this situations in analysis reinforced concrete when a severe strain localizations occurs and unloading of adjacent elements on cracking, leading difficulties in solution convergence still persist, while the procedure repeatedly gives complex roots. Crisfield(1983,1984) for avoiding this problem, introduced a line searches, by multiplying the both terms of Eqn 14 for by a factor , determining by minimization of potential energy, obtaining a considerable improvement. However, exist in the literature another procedures to avoid this problem, that will be described in the following.
4.1 Method 1. Lam and Morley procedure
Lam and Morley (1992) proposed a method in a pseudo-line search based to avoid the complex roots by introducing a scaling parameter in the usual constraint equation, that is, however, computed without introducing energy considerations. According to Eqn 21, in order to get the real root, the parameter , and in Eqn 22.a, 22.b and 22.c respectively have to satisfy that
|
|
(23) |
Which lead to
|
|
(24) |
After some algebra, we get the following quadratic equations in
|
|
(25) |
where
|
Note that all this terms can be computed at the th iteration in . Newly computed the value of and chosen the more convenient value, is then fed back into original constraint equation which is solved again. Suitable value of this scaling parameter are chosen close to 1. Zhou and Murray (1994) suggested that suitable value of should be chosen from . A suitable value of proposed by Lam and Morley [1] is chosen as below:
|
where and are roots of ; and . Usual, a value of is take as . While we found in some certain situation in the practical calculations, should be chosen carefully to avoid problems of numerical precision 1. The value of parameter is initially set to 1; with the consequent divergence of solution process due to complex. This way the problem of complex roots can be avoided successfully. The authors further report that generally the quadratic equation solved for gives real values, but in case it lead to complex values, the following strategy explain in Method most be adopted.
(1) By author's experiences, it necessary to take care about computer precision, due to sometimes the value of the quantities in quadratic equations are really small and can be lost significant digits.
4.2 Method 2. Elimination of r⊥
Generally the quadratic equation 25 solved for gives real roots. Since it is not possible to find a real roots to give the chosen arc length, Lam and Morley (1992) suggested that the main problem is that the orthogonal error is too large. In case that Eqn 25 leads to complex values, the follow procedure proposed by Lam and Morley (1992) is adopted [4].
- Compute the displacement due to the orthogonal component of out-of-balance load vector (orthogonal to applied load vector) and update the displacement
(28) where superscript is related to the complex roots.
- Compute associated nodal forces .
- Compute incremental loading parameter and the arc-length from orthogonal component of out-of-balance force vector.
(29.a) (29.b) (29.c) - Reduce the loading parameter by multiplying the loading parameter by the ratio of original arc-length to arc-length associated with complex roots, and iterate the solution process.
(30.a) (30.b) (30.c)
Compared with reducing arc-length directly, this method is more targeted to eliminate residuals and hence should be more effective.
4.3 Method 3. No solution of quadratic equations
Forde and Stiemer (1987) proposed another arc-length method in which the direct solving of quadratic equation 21 is not required, and thus the problem of dealing with complex roots is avoided. These kind of arc-length methods are called arc-length orthogonality methods. In the standard incremental iterative solution of equilibrium equation for proportional loading, the incremental displacement can be written in two components.
|
|
(31) |
The first is the displacement due to a unit load factor multiplied by the incremental variation in the load level . The second is the displacement update for a conventional load controlled procedure due to the unbalanced loads. Therefore, A general arc length procedure can be derived from orthogonality principles:
|
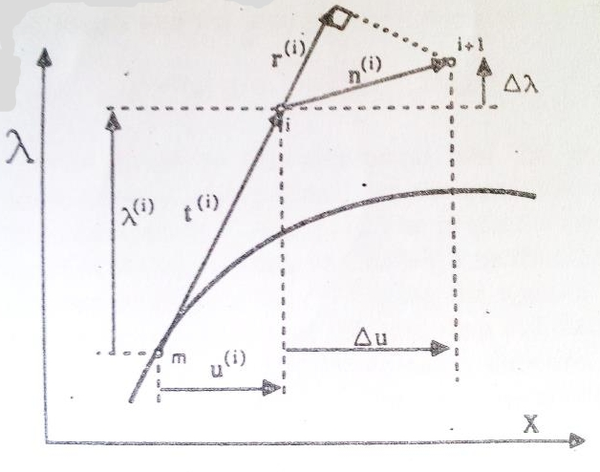
in which is the tangent of the current incremental load-displacement configuration, while is an arbitrary update direction chosen with reference to , see Figure 3 .
The scalar product of these vectors yields a residual . Form the scalar product using equations 31,32 and 33 a general expression can be derived for
|
The expression can be simplified for particular cases of orthogonality. The use of the method simplifies the solution process. The method reveals exactly similar results for as obtained by Crisfield (1981) but without solving quadratic equation and selection of proper root [4].
|
| Figure 3: arc-length orthogonality method. |
5 The choice of the appropriate root
The iterative load factor is normally chosen as the solution to the quadratic equation that yields the minimum angle between and (Crisfield, 1991), i.e. is the solution of 21 which gives the maximum product [5]:
|
|
(36) |
6 Solution formulation at beginning of the iteration
The arc-length increment for the loading step is determined by the following procedure:
|
where is the arc-length increment of the previous loading step, is the desired number of iterations for the loading step before convergence and is the number of iterations required to converge in the loading step.
The first iteration from the previous converge point is a predictor solution in which the appropriate cannot be obtained by solving the quadratic equation showed above. Lam and Morley (1992) proposed a formation of and by introducing a scalar
|
where corresponds to quantities of previous converged step. Another formation is also widely used in the cylindrical arc-length method (in which is set equal to zero), written as
|
While in both formation, the sign of the should be choose carefully to avoid track back on the current path (Crisfield, 1991). Many procedures are developed to predict the continuation direction, i.e. to choose the sign of that carries on tracing the current solution path. Some criteria are listed below:
- Stiffness determinant. Follow the sign of the actual tangent stiffness determinant:
(42) - Incremental work. Follow the sign of the predictor work increment:
(43) - Secant path (Feng et al., 1995, 1996). The sign of is determined as:
(44)
Criteria are implemented in program NOLM. Procedure (a) is widely used in commercial finite element codes and works well in the absence of bifurcations. In the presence of bifurcations, however, it is known not to be appropriate and fails in most cases. As pointed out by Crisfield (1991), its ill-conditioned behaviour stems from the fact that the sign of changes either when a limit point or when a bifurcation point is passed. In this case, the predictor cannot distinguish between these two quite different situations, unless further (usually computationally expensive) analyses are undertaken. In the presence of a bifurcation, instead of following the current equilibrium path, the solution will oscillate about the bifurcation point. This property is mathematically proved by Feng et al. (1997). Procedure (b), on the other hand, is blind to bifurcations and can continue to trace an equilibrium path after passing a bifurcation point. However, this criterion proves ineffective in the descending branch of the load-deflection curve in snap-back problems, where the predicted positive slope will provoke a back tracking load increase. One important feature shared by the criteria (a) and (b) is the fact that they rely exclusively on information relative to the current equilibrium point (at the beginning of the increment). The decision on the sign of is made without considering the history of the currently traced equilibrium path. In situations such as the ones pointed out above, this may result in wrong direction prediction. In contrast, a key point concerning criterion is the fact that carries with it information about the history of the current equilibrium path [5].
6.1 Summary Arc Length Algorithm Procedure
A basic arc length algorithm implemented in NOLM program is summarized in the following box depicted in 6.1. This algorithm correspond to the spherical arc-length method, however, with small change in the code, a cylindrical arc-length procedure can also be used .
Arc length scheme.
- In step , assuming that we converged in step , initialize iteration counter, , and set initial guess for displacement and incremental load factor.
- Assemble the tangent stiffness matrix or a projection of it: . It is important to calculate it because the quadratic convergence is ensured and also the snap-back point and bifurcation points can be localized.
- Set . Solve the linear systems for perpendicular solution and for the tangential solution :
- Find iterative load factor
- if (predictor solution) then compute:
- if then solve the spherical arc-length constraint equation
with coefficients defined by 22.a, 22.b and 22.c and choose root according to 36 if real roots was found.
- if complex root was found solve the quadratic equations for in 25 and choose a suitable value for according to 27.a, 27.b 27.c,27.d. If real roots was found, come back to b and try again to solve the quadratic equation for in 21.
- Is a complex value of was found apply Method , i.e, eliminate and update the new value of , and according to 30.a, 30.b and 30.c.
|
|
|
|
|
|
|
|
|
|
|
|
7 Smeared Isotropic Rankine Damage Models
7.1 Constitutive Equation
In the last years, the so-called continuum damage model have been widely accepted as an alternative to deal with complex constitutive behavior. This approach has proved simple and versatile, as well a rigorously based in fundamental constitutive theory. The continuum damage model explains the process of gradual material deterioration induced by nucleation and grown of multitude of micro-defects. It is based on the definition of effective stress, which is introduced in connection with the hypothesis strain equivalence. In others words, the strain associated with a damage state under the applied stress is equivalent to the strain associated with its undamaged state under effective stress . This damage state is monitored trough a single internal scalar variable, called damage or degradation , . This variable is a measure of the lost of secant stiffness of the material, and it ranges from for undamaged material to for fully degradated one .
In the present work, the effective stresses are computed in terms of the total strain tensor as
|
|
(45) |
where is the secant fourth order constitutive tensor and denotes double contraction. The constitutive equations for the scalar isotropic damage model used in this work is:
|
|
(46) |
where is the linear elastic constitutive tensor. This equations reveals that the material stiffness is only affected by a scalar factor and therefore isotropic is preserve and the explicit integration of the constitutive equation is achieved, as only current values of strains and damage.
7.2 Isotropic damage model
The model defined in equation (45) is fully determined if the value of can be evaluated at every time of the deformation process. To that extends one must define a equivalent effective stress or a suitable norm, . It is used to compare different states of the stress, so that is possible to define such concepts as loading , unloading and reloading , well known as Kuhn-Tucker conditions. The norm is a scalar and positive function and have a zero value for the undeformed state. In this work, the equivalent stress will assume the following form:
|
|
(47) |
where is defined as ratio compressive strength/tensile strength and is a weighting factor depending on the state of stress . A satisfactory definition of is
|
|
(48) |
where are the Macaulay brackets . Note that the values of range from for triaxial compression to one for triaxial tension and for intermediate stress a value betweens . With the above definitions for the equivalent effective stress, the damage criterion, , formulated in the undamaged stress spaces, is introduced as:
|
|
(49) |
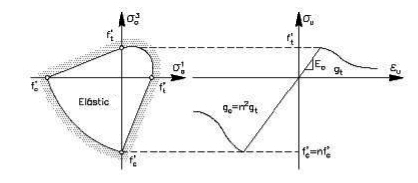
where the is the norm described before and is the current damage threshold at the time . This last value is an internal stress-like variable whose controls the size of damage surface. If is the initial threshold value, in this case, the initial uniaxial damage stress(tensile strength), it must be . Damage occurs when the norm exceeds the current threshold value. Fig 4 shows the elastic domain of the function defined in Eqn 49.
|
| Figure 4: Elastic domain selected for the isotropic damage model. |
The evolution of the damage bonding surface for loading, unloading and reloading conditions is controlled by the Kuhn-Tucker relations and the damage consistency conditions, which are
|
|
(50) |
leading, in view of equation (49) , to the loading condition
|
|
(51) |
This, in turn, the evolution of the internal variable may be explicitly integrated to render:
|
|
(52) |
Note that (51) allows to compute the current values for in terms of the current value of , which depends explicitly on the current total strains. Stress softening is controlled by the softening function . In this work, the following exponential softening law is used:
|
|
(53) |
where is the softening parameter which defines the softening response, dependent on the element size and also sets a maximum size for the elements that can be used in the analysis. The figure shows a schematic representation of this function. Finally, the damage index is explicitly defined in terms of the corresponding current value of damage threshold,
|
|
(54) |
so that it is monotonically increasing function such that .
7.3 Mechanical Dissipation
The mechanical free energy for an isotropic damage model is defined as follows:
|
|
(55) |
Thus, the rate of energy dissipation may be written as
|
|
(56) |
Consider now an uniaxial experiments in which the tensile strain increases monotonically and quasi-statically from an initial unstressed state to another in which full degradation takes place. In this case, , where is the Young's modulus and . Therefore, for any process the total specific dissipated energy (per unit volume) is
|
|
(57) |
Combining equation (57) with (54) results:
|
|
(58) |
Finally, as it is usual in smeared crack models, it is possible to relate the specific dissipated energy
|
|
(59) |
where is the mode I fracture energy per unit area (assumed to be a material property) and is the computational width of the fracture zone well knows as element characteristic length, that is computed depending on the geometric dimension of the element. Therefore, the parameter can be expressed
|
|
(60) |
where the specific softening parameter measures the brittleness of the material and , the elemental softening parameter measures the brittleness of the element. For linear simplex element, the characteristic length can be taken as the representative size of the element, . In this work, and assuming that the elements are almost equilateral, the size of the element can be computed for quadrilateral elements being the area of the finite element. It is interesting to comment that for a linear irreducible formulation, the discrete localization band is only one element across. The box 7.3 shows the very simple algorithm has to be used to evaluate stresses using this smeared crack models. Note the updating of the threshold value of as the nonlinear behavior proceeds:
boxed BOXBox
Smeared Isotropic damage model.
- Initial Data for time
- Material Properties ,, , , ,
- Current values: , and
|
|
|
|
|
|
|
|
8 Validation Examples
The application of the arc-length method is presented in this work to the problem of softening material and catch the equilibrium path of the structure. The arc length method was integrated in NOLM program, together to a smeared isotropic damage model and no linear truss element. We begin to solve a very simple problem using this non linear truss element as a benchmarking. Results reveals the strong snap through and snap back in the equilibrium path of this examples.
Other examples concerns to the continuum models discretized in quadrilateral elements using the smeared crack model coded in NOLM. Another constitutive laws, implemented in NOLM is used. However, no mechanical dissipation and objectivity exist, so a very difficult convergence is found is some situations. We proposed an objective mechanical dissipation for future work to take account the dissipated energy, related strongly with the plastic work of the model. For quadratic convergence for the described isotropic smeared crack model is necessary to apply the tangent stiffness matrix. However, it is really difficult to compute and other alternatives need to be adopted. The most common way to get a projection of the tangent stiffness matrix is applying the perturbation method. But, in the present work we used the secant stiffness matrix defined as . This can be effectively used, but not quadratic convergence is guaranteed. In any case is more faster than using the non-damage stiffness matrix. However, in presence of snap back points, sometimes is encountered some difficult to converge.
It was coded in NOLM subroutines allow connect the results for future reading in Gid, the Pre and post-processing developed at CIMNE [6].
8.1 Two 2D nonlinear truss element
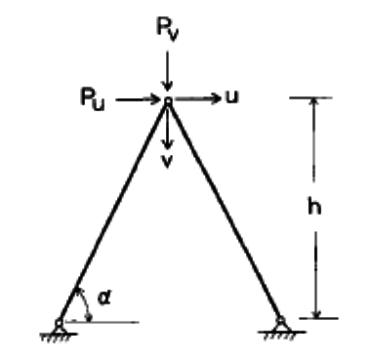
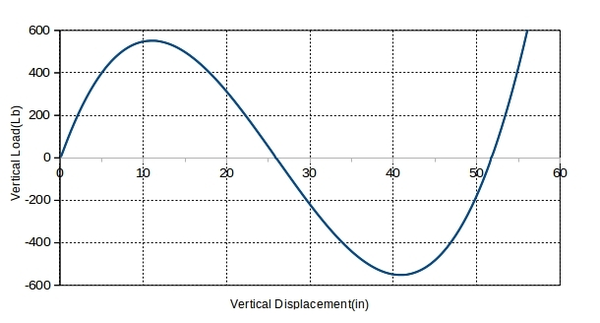
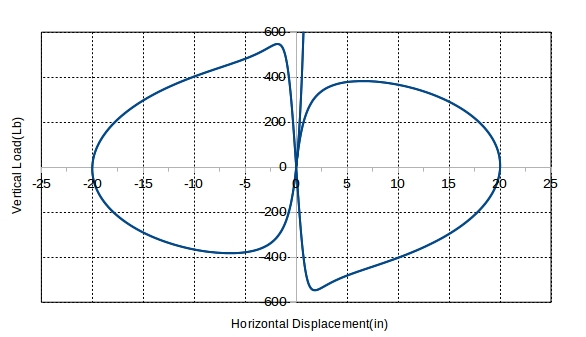
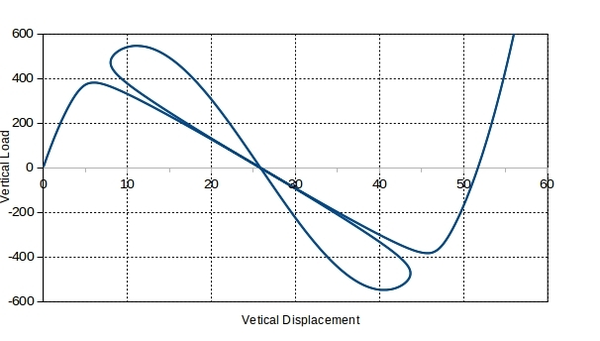
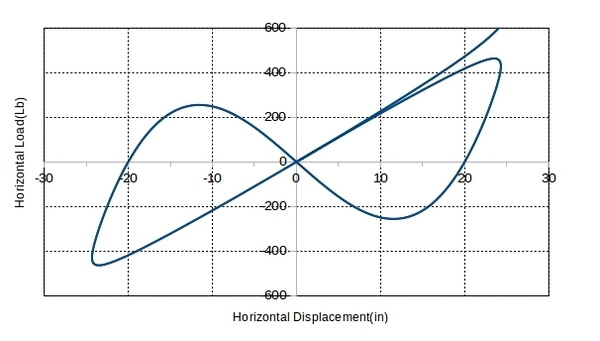
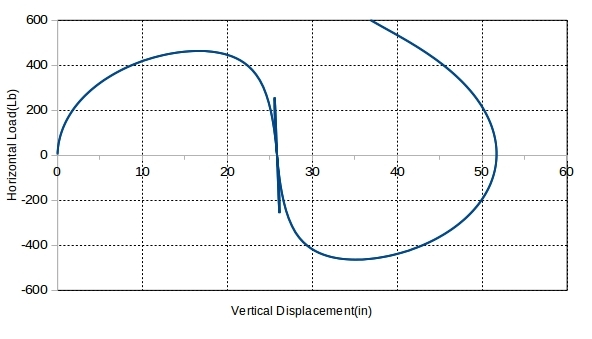
The first numerical example consist of two-member nonlinear truss element shown in the figure 5 and has been widely used as a benchmark problem for comparison of numerical solution algorithm. The following material are assumed: Axial rigidity , and degrees. The same example was tested by Yang and Shieh (1990). Three loading cases will be studied herein. In the first case (Case I), only a vertical load is imposed; secondly (Case II), the horizontal load is considered as an imperfection, i.e and the third one (Case III), the vertical load is treated as an imperfection, i.e . The results obtained by the present method for the three considered cases are shown in Figs 6, fig:Sec4-3 and 9 respectively, which are according with solution presented by Pecknold et al (1985).
Note that, in the first case an snap-through is obtained. As can be seen in the figure fig:Sec4-3, there are four limits points and two snap back points. The present analysis has demonstrated the self-adaptive capability of this implemented arc-length method. At the third case, the observation for the first load can also be applied here.
|
| Figure 5: Two non-linear truss element. Geometry and boundary conditions. |
|
| Figure 6: Analysis result for case I. |
|
|
| (a) Vertical Load vs horizontal displacements. | (b) Vertical Load vs vertical displacements. |
| Figure 7: Analysis results for Case II. | |
|
|
| (a) Vertical Load vs horizontal displacements. | (b) Vertical Load vs vertical displacements. |
| Figure 8: Analysis results for Case III. | |
8.2 A simple benchmarking example8.2 A simple
2
D
{\displaystyle 2D}
benchmarking example
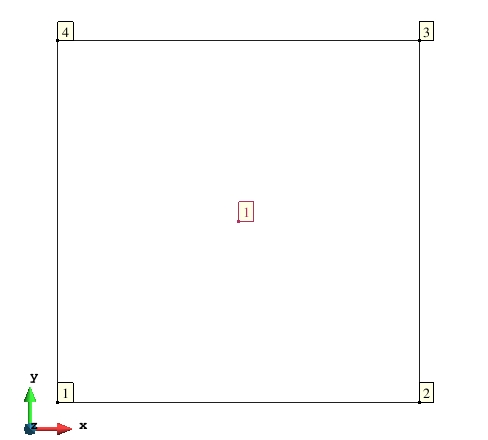
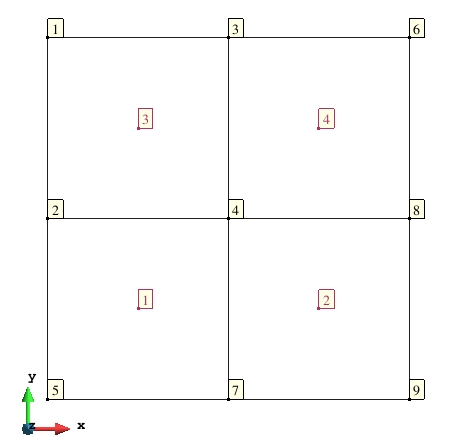
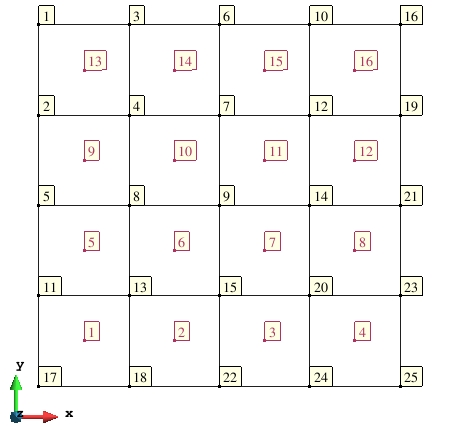
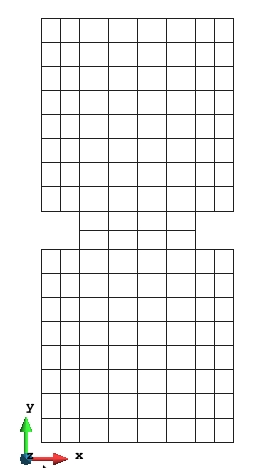
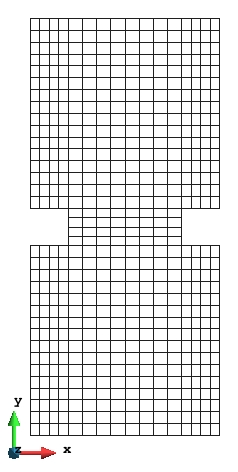
In this example, we test our code of arc-length method with a problem of square non-linear material under tension. A simple block discretized in , and quadrilateral bilinear element and drown in figure 9, 10a and 10b respectively, are analyzed both Von-Mises linear/exponential softening model and Drucker-Prager linear/exponential model. A plain strain analysis is performed. Material are assumed and is depicted in table 1. The softening modulus for linear softening was taken . For exponential softening, we take the following formula for evolution of shear stress
|
|
(61) |
where the equivalent plastic strain and is a constant that controls the softening curve, here assumed to be . Note that this models, is not objective due to no dissipation of energy is controlled. For define a DP-Model, the parameter , that controls the pressure is assumed . Take into account that the objective of this examples is testing the AL method implemented in NOLM.
| Material Data | Value() |
| Young's Modulus | 10 |
| Poisson's ratio | 0.33 |
| Shear strength | 1 |
|
| Figure 9: Mesh . |
|
|
| (a) Mesh . | (b) Mesh . |
| Figure 10: Analysis meshes cases. | |
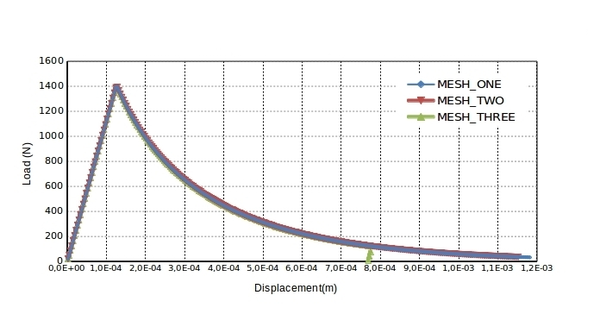
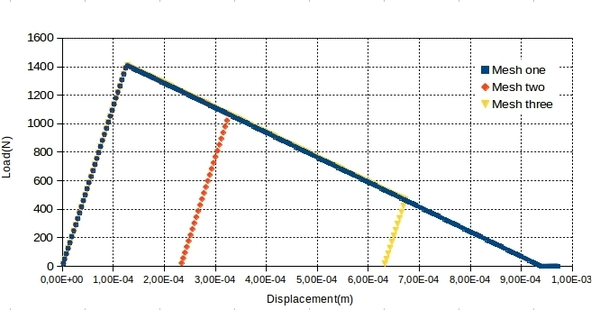
The results of the analysis is plotted in figures 11 and 12. Observe that for both material model, identical responses is obtained for the three different meshes when is used the same softening low. However, although not was used a energy dissipated criteria, all element have the same geometric properties making the softening responses objective.
8.3 A pull test benchmarking example8.3 A
2
D
{\displaystyle 2D}
pull test benchmarking example
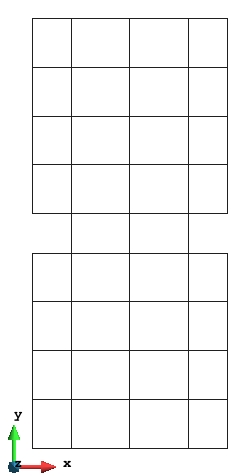
In this example, analysis of a cracked flat under surface tension is taken to test our code of arc-length method. We selected three different sizes of meshes of the same model depicted in figure 13 and calculated with perfect plastic Drucker-Prager model, perfect plastic Von-Mises model and exponential softening Von-Mises model. We also tested the influence of different softening parameters with exponential softening Drucker-Prager model. The same material used in the previous example are assumed again. A plain strain analysis is performed. The analysis cases are
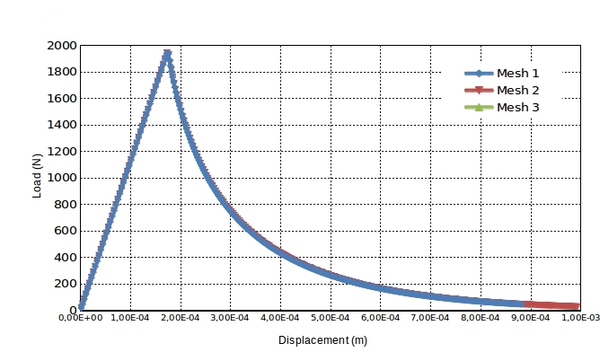
- For Drucker-Prager model with exponential softening taken and and . Case I.
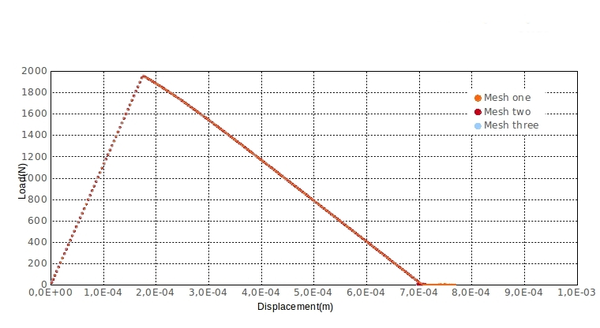
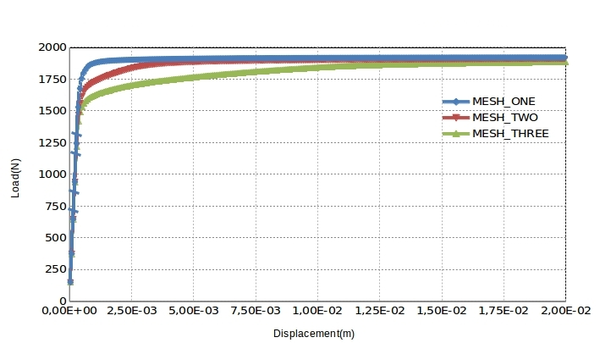
- For Von-Mises model with perfect plastic. Case II.
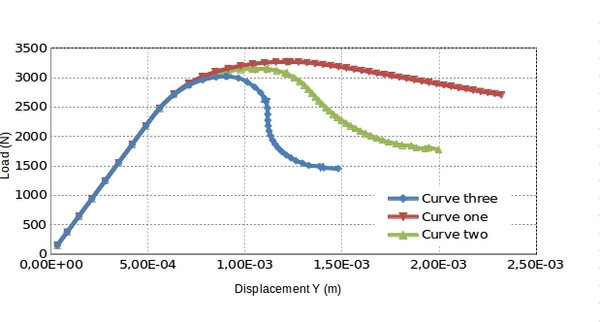
- For Von-mises model with with exponential softening . Case III.
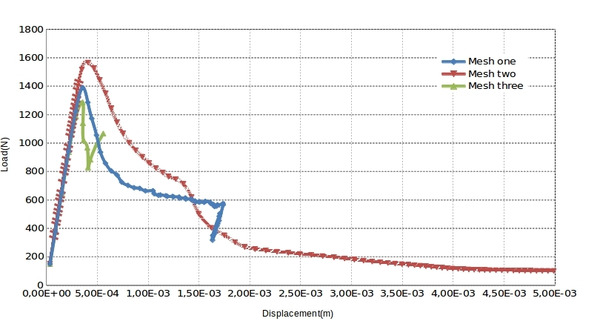
The Case I is represented is the figure 14. Observe how the AL method obtain the softening behavior and thre different responses and post-pick load are obtained when is used different values of . Case II represent a perfect plastic behavior and the analysis results is plotted in fig 15. Note how the AL method implemented obtained the expected perfect plastic behavior. The Case III analysis is depicted in figure 16. Note how the results is not objective due to no dissipation is controlled. As a future work, is necessary to implement a mesh objective dissipation in the standard model material implemented in NOLM.
|
|
| (a) Mesh one. 50 nodes and 34 elements. | (b) Mesh two. 605 nodes and 544 elements. |
| |
| (c) Mesh three. 167 nodes and 136 elements. | |
| Figure 13: Finite element meshes for analysis. | |
|
| Figure 14: Responses of pull test using three different parameter in exponential softening. |
|
| Figure 15: Perfect plastic response for three meshes using Von-Mises model. |
|
| Figure 16: Non objective response in Von-Mises material with exponential softening. |
8.4 A notched beam8.4 A
2
D
{\displaystyle 2D}
notched beam
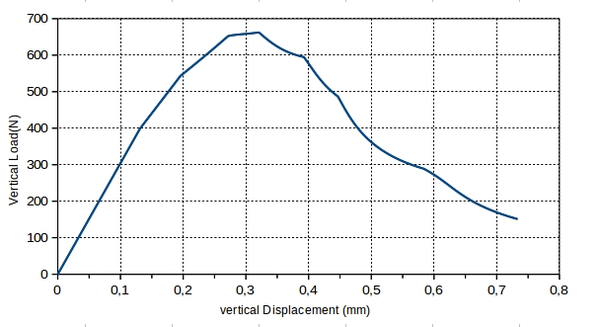
In this example, we have selected for analysis a notch beam tested by Petterson(1981) . The major adantages of this experiments are that it has been repeated several times and that necessary material parameter, such as , has been carefully specified. Finite element meshes, dimension and properties are shown in figure 17. nodes and quadrilateral bi-linear element was used in the analysis. We are assuming a plane stress state for this model. The beam is subjected to a point load in the top center, producing a direct traction in the notch. An exponential softening curve was used according to the average element size. The analysis were performed by full arc-length method implemented and the smeared isotropic crack model described. The figure 18 compare experimental results and numerical load deflection curves. Note how the softening behavior can be satisfactorily simulated together with the maximum load.

|

|
| (a) Geometry and material properties. | (b) Mesh for analysis. |
| Figure 17: Finite element meshes for analysis and basic properties. | |
8.5 Double cantilever beam benchmark
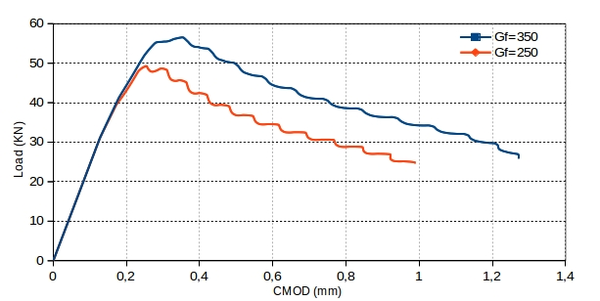
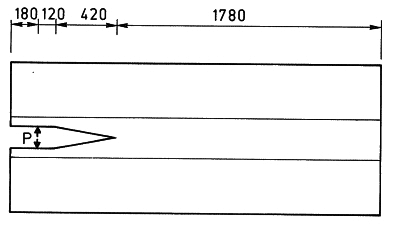
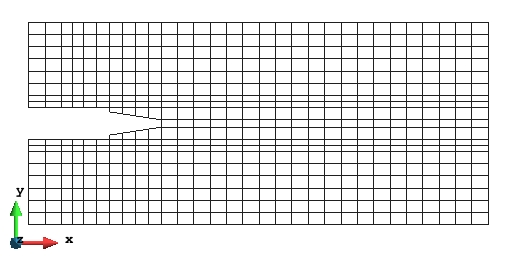
Fig shows 19 a Double cantilever beam (DBC) tested by Sock, Baron and Fracois(1979). In this work, we used the smeared crack models using two different fracture energy to guarantee objective dissipation. A total number of nodes and linear quadrilateral elements was used for discretization. This example is selected because represent a pure mode I of fracture. However, some simplifications is done in the model with respect to the original model, due to this example is aimed to test the arc length method. Material properties is drown in table 2. Note that for define the smeared crack model is only required parameter. In fig, the load is plotted against the crack mouth opening displacement (CMOD). The computation was performed for exponential softening and assuming a plane stress state.Development of the fracture Zone is represented in fig. 4.8 which represent the evolution of damage (fracture process ) For three different process in the calculation.
|
|
| (a) Geometry properties. | (b) Mesh for analysis. |
| Figure 19: Finite element meshes for analysis and basic properties. | |
| Material Data | Value() |
| Young's Modulus | 40 |
| Poisson's ratio | 0.2 |
| Tensile strength | 4 |
| Fracture Energy | 350 |
| Fracture Energy | 250 |
Due to the boundaries condition apply, the forces tends to open the beam in front of the notch and all damage process begin in this place. Damage progresses gradually as the loading process increases and finally the beam is separated in two part. The evolution of damage to the end of simulation is potted in 21b . Note that when the damage reaches the value of , means that this zone is totally smeared cracked.
![Contour Sxx Cauchy Stress field at the end of simulation. (Gid pre-post processor[6]).](/wd/images/thumb/8/86/Draft_Samper_836349612-Fig_18a.png/600px-Draft_Samper_836349612-Fig_18a.png)
|
![Evolution of damage for \mathcalGf1 at the end of simulation. (Gid pre-post processor[6]).](/wd/images/thumb/6/66/Draft_Samper_836349612-Fig_19a.png/600px-Draft_Samper_836349612-Fig_19a.png)
|
| (a) Contour Sxx Cauchy Stress field at the end of simulation. (Gid pre-post processor[6]). | (b) Evolution of damage for at the end of simulation. (Gid pre-post processor[6]). |
![Direccion of principal stress at the end of simulation. (Gid pre-post processor[6]).](/wd/images/thumb/e/e2/Draft_Samper_836349612-Fig_41b.png/600px-Draft_Samper_836349612-Fig_41b.png)
|
![Deformed mesh (×500). (Gid pre-post processor[6]).](/wd/images/thumb/c/ce/Draft_Samper_836349612-Fig_42b.png/600px-Draft_Samper_836349612-Fig_42b.png)
|
| (c) Direccion of principal stress at the end of simulation. (Gid pre-post processor[6]). | (d) Deformed mesh . (Gid pre-post processor[6]). |
| Figure 21: Double cantilever beam analysis. | |
9 Conclusion, recommendations, actual and future works
9.1 Conlcusion
In this work we introduced and implemented the AL method in NOLM program. Basically the actual implementation in NOLM is based in the work proposed by Lam and Morley (1992) and was coded with take into account the sign for no tracking back the solution. An efficient method was included for avoid complex roots and if the problem persist, two method is available to get the convergence. In case of no convergence is reached, we introduce a user factor, for reducing the arc-length, that should be taken betweens per cent of the actual arc length.
A linear truss-element, together to the isotropic smeared crack model was introduced for testing and benchmarking the AL method . During the work, we found several difficulties to converge in the standard constitutive law implemented in NOLM when a softening parameter was introduced. It is caused by the no mechanical dissipation in the model. However, for a perfect plastic an hardening they get the corresponding results.
All meshing process and post-processing was made with Gid[6], proving that it is possible to connect the developed owner software and this Pre-and post processing program.
9.2 Recommendations
By author experience, it is recommended, as a future work, the redesign of the basis of the NOLM code. Difficulties are found in debugging process when several static variables, jumping ( GO TO sentences) and writing process was used. Some bugs was fixed, one of them related to the solver and solution flag processes.
Its really necessary the checking and testing of the constitutive models implemented in NOLM with its corresponding benchmarking. Also recommended the change of the data base of NOLM (Common Block A), due to lost of memory and a lot of them are not using in a real run time calculations and the difficulties that could be encountered for parallelization.
The storage of the global stiffness matrix can be done in a parallel way. However, the needed to know the exactly position of its terms make difficult a future parallelization. In other words, not only be considered the parallelization of the solver using MKL Pardiso, but also all looping in elements, conditions and nodes. A suitable way to reaches this objectives is a modular or object programing inside NOLM, now available in the new INTEL COMPILER versions.
9.3 Actual and future works
The actual and future works are aimed to checking standard constitutive laws integrated in NOLM and coded and objective dissipation in the finite element. This can be done with a small relative change in the softening parameter curve adding the characterized length of the elements.
Integrating an analysis of bifurcations points when convergence can not reaches using the AL method for stopping or tracing another possible equilibrium path for the next iteration step. It is done by checking the determinant of the global stiffness matrix using the LU decomposition.
BIBLIOGRAPHY
[1] Lam, W. and Morley, C. (1992) "Arc‐Length Method for Passing Limit Points in Structural Calculation", Volume 118. Journal of Structural Engineering 1 169-185
[2] Cinthia A. G. Sousa and Paulo M. Pimenta. (2010) "A new parameter to Arc-Length method in non-linear structural analysis", Volume XXIX. Mecánica Computacional 1841-1848
[3] J.V. Ferreira and A.L. Serpa. (2005) "Application of the arc-length method in nonlinear frequency response", Volume 284. Journal of Sound and Vibration 1–2 133–149
[4] MEMON Bashir-Ahmed, SU Xiao-zu. (2004) "Arc-length technique for nonlinear finite element analysis.", Volume 5. J Zhejiang Univ Sci 5 618-28
[5] de Souza Neto, E. A. and Peri, D. and Owen, D. R. J. (2008) "Computational Methods for Plasticity". John Wiley & Sons, Ltd 1–15
[6] GiD. (2009) "The Personal Pre and Post Processor"
[7] M. A. Crisfield. (1986) "Snap-through and snap-back response in concrete structures and the dangers of under-integration", Volume 22. International Journal for Numerical Methods in Engineering 3 751-767
[8] Kyoung Soo Lee and Sang Eul Han and Taehyo Park. (2011) "A simple explicit arc-length method using the dynamic relaxation method with kinetic damping", Volume 89. Computers & Structures 1–2 216–233
Document information
Published on 05/03/18
Submitted on 05/03/18
Licence: CC BY-NC-SA license
Share this document
claim authorship
Are you one of the authors of this document?
