(Created page with " ==Abstract== This article presents a simple comparative model which has been developed for the estimation of the performance of photovoltaic (PV) products' cells in indoor...") |
m (Scipediacontent moved page Draft Content 127772822 to Apostolou et al 2016a) |
(No difference)
| |
Latest revision as of 15:12, 1 June 2017
Abstract
This article presents a simple comparative model which has been developed for the estimation of the performance of photovoltaic (PV) products' cells in indoor environments. The model predicts the performance of PV solar cells, as a function of the distance from a spectrum of artificial (fluorescent light, halogen light, and light-emitting diodes) and natural light. It intends to support designers, while creating PV-integrated products for indoor use. For the models validation, PV cells of 12 commercially available PV-powered products with power ranging from 0.8 to 4 mWp were tested indoors under artificial illumination and natural light. The model is based on the physical measurements of natural and artificial irradiance indoors, along with literature data of PV technologies under low irradiance conditions. The input data of the model are the surface of the solar cell (in m2), the wavelength-dependent spectral response (SR) of the PV cell, the spectral irradiance indoors, and solar cells distance from light sources. The model calculates solar cells' efficiency and power produced under the specific indoor conditions. If using the measured SR of a PV cell and the irradiance as measured indoors, the model can predict the performance of a PV product under mixed indoor light with a typical inaccuracy of around 25%, which is sufficient for a design process. Measurements revealed that under mixed indoor lighting of around 20 W/m2, the efficiency of solar cells in 12 commercially available PV products ranges between 5% and 6% for amorphous silicon (a-Si) cells, 4–6% for multicrystalline silicon (mc-Si) cells, and 5–7% for the monocrystalline silicon (c-Si) cells.
Introduction
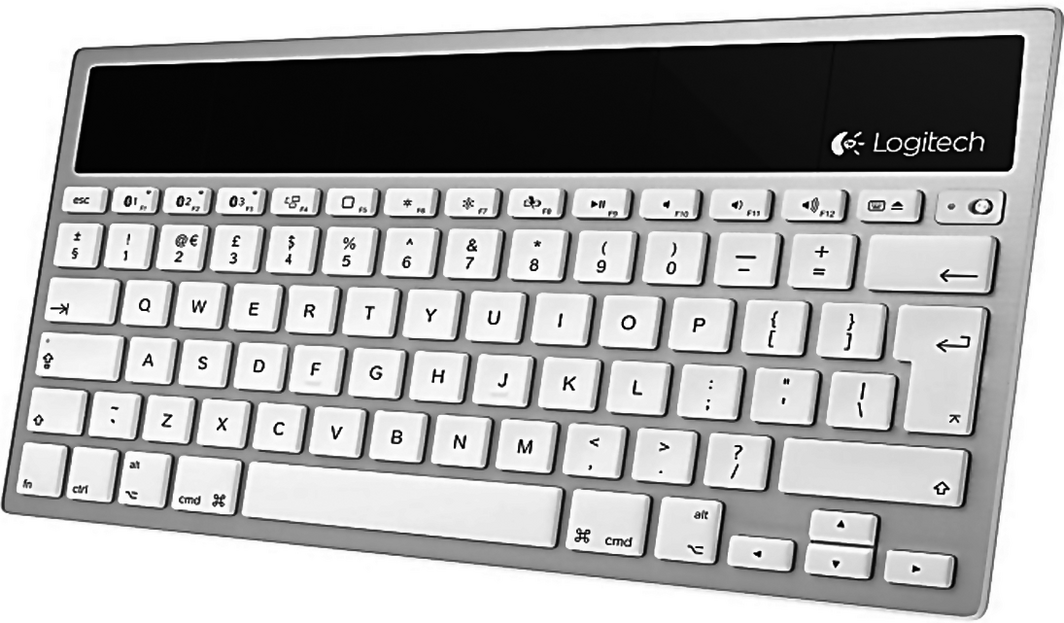
The term product-integrated photovoltaic (PIPV) [1, 2] is used for all types of products that contain solar cells in one or more of their surfaces, aiming at providing power during the use of a product. The application of photovoltaics (PV) as a power source for consumer products is already common for more than 30 years, since the first solar calculators. Thereafter, integrated solar cells in consumer products became more popular and at present PV cells are applied in both indoor and outdoor applications, for example, lanterns, chargers, speakers, bike lights, solar watches, etc. A product can be defined as a PIPV product mainly by the existence of integrated PV cell(s) on at least one of its surfaces and the internal use of energy, which is generated by the PV cell(s) [1] (see Fig. 1, example of PIPV).
|
|
|
Figure 1. Solar-powered keyboard by Logitech [3]. |
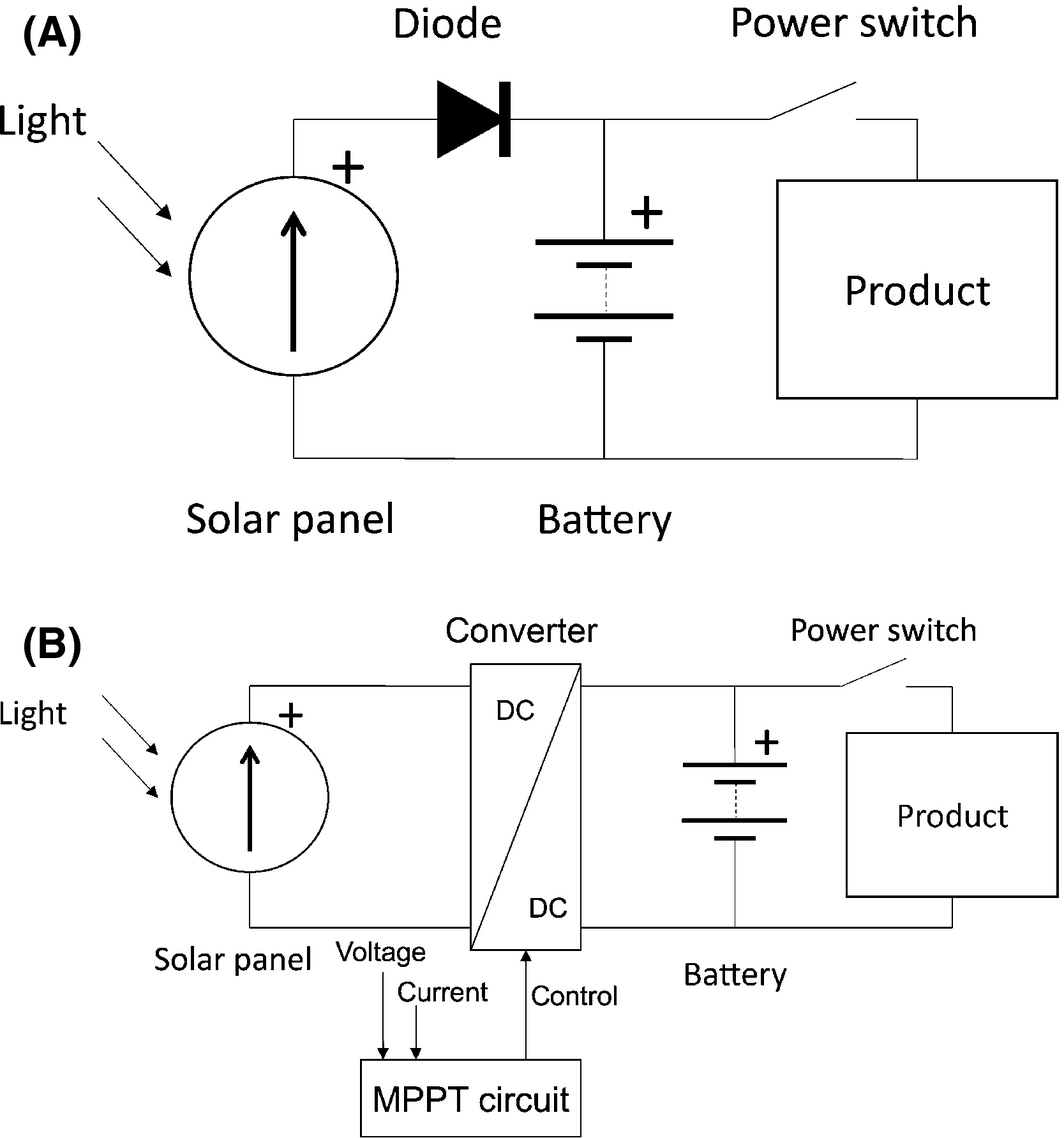
Figure 2A depicts the basic power system of a PV-powered product. Basic elements are solar cell, an energy storage device (i.e., a capacitor or battery), and a diode to prevent discharging of the battery through the solar panel. Matching of the battery voltage with the solar cell is done by creating a small solar panel with the right number of solar cells in series for an appropriate voltage. In more advanced systems (Fig. 2B), a DC/DC converter matches the solar panel voltage and the battery voltage.
|
|
|
Figure 2. (A) Simple and (B) advanced circuit scheme of a PV product. |
After systematic investigation of 90 PV products [1], we conclude that some combinations of PV cells and batteries seem more common than others; a-Si cells combined with Li-ion batteries are common for PV products that are mainly used indoors (around 16%) [1], while a-Si cells combined with alkaline or nickel-based batteries are used in PV products for both indoors and outdoors (around 20%) [1]. Furthermore, c-Si or m-Si cells with Li-ion or nickel-based batteries (NiMH, NiZn) are used for PV products that are mostly used in outdoor environments (around 28%) [1].
Three categories of PV products can be distinguished: PV products for indoor use, for outdoor use and for both indoor and outdoor use, called “mixed.” Another distinction made concerns the PV product size. Two categories are distinguished, the small or thin PV products and the large or thick, covering product sizes in the range of 2.7 × 10⁻⁴ m2 (the product with the smallest PV cell area among the tested products) to 87 × 10−4 m2 (the product with the largest PV cell area among the tested), respectively.
The integration of PV cells into consumer products creates several advantages. The environmental benefits [5] could be significant, by entirely avoiding the use of primary batteries, or by enhancing the integration of rechargeable batteries. Thus, energy efficiency would be increased and battery waste would be reduced [6, 7]. Second, the use of artificial light as an irradiance source for in-house PV products does not require electricity [8]. Consumer electronics typically include rechargeable batteries that need to be connected to the grid for charging. Solar-powered products are operated autonomously and can provide independence and convenience to the user, as they can be charged when no grid connection is available, provided that sufficient light is available.
Although PIPV market is rapidly growing [2], there are still many issues that have not been extensively analyzed which mainly concern the use of PIPV indoors. The prominent issue is that while most of the PV products perform well under direct sunlight, they have a remarkable drop in their performance indoors [9]. The efficiency of solar cells is usually measured under STC conditions (AM1.5 spectrum, 1000 W/m2, 25°C). However, the indoor spectrum is often a combination of natural and artificial light, and the irradiance levels range between 0 and 100 W/m2. At low irradiance conditions, below 100 W/m2, solar cells perform differently, which is something that should be taken along in a design of a product. This is therefore the core scope of our study; the effect of indoor irradiance conditions on the design of PV-powered product or PIPV. In this study, we focused on PIPV containing PV technologies that occur most often [1, 10], that is, crystalline silicon (c-Si), multicrystalline silicon (mc-Si), and amorphous silicon (a-Si), under artificial irradiance of compact fluorescent lamps (CFL), light-emitting diodes (LED), incandescent light, and indoor irradiance originating from solar light.
At the moment literature is limited regarding research done on solar cells' performance in indoor environments. Several researchers studied the PV cells' performance under low irradiance conditions [11-13], indoor light conditions, and light spectra [14-16], the spectral irradiance of various PV technologies under different irradiance conditions, methods for optimal design of PV-powered products [1, 2, 11, 17-21], and the development of simulation tools for irradiance conditions and energy calculations of PV-powered devices [22-24]. Some studied methods are the use of CAD software for the simulation of indoor irradiance [23, 24], the use of ray tracing programs, such as the radiance or the DAYSIM [22], or spectral irradiance measurements of low intensities in indoor environments [14].
Based on literature, it seems that there are no models available, which estimate the performance of PV cells under low indoor irradiance, which has been measured, and which comprises both natural and artificial irradiance. Most models that are available calculate the efficiency of PV cells under high irradiance, such as under standard test conditions or under very specific simulated weak irradiance (e.g., 10 or 100 W/m2), which can differ from measured indoor irradiance.
Our modeling approach is based on the performance of the abovementioned PV technologies under indoor irradiance conditions. For the validation of the model, we used a sample of 12 commercially available PV products for which we compare simulated results with real measurements indoors, under various irradiance conditions. The analyzed products' sample consists of small PV products for either indoor or outdoor use: four PV-powered lighting products, two solar toys, three PV-powered chargers, a solar keyboard, a solar computer mouse, and one PV kitchen weight scale.
The structure of our article is as follows: in the “'Indoor Light'” section, we shortly discuss indoor irradiance. Next we explain the modeling approach in the “'Model Description'” section. In the next section ('Experiments'), the experimental setup is presented which was used to validate our model using measurements of 12 PV products, and then results derived from simulations with the model are described. Finally, the discussion and conclusions of this study are presented.
Indoor Light
In this section, we will introduce indoor irradiance as a mixture of artificial and natural light. With natural light we mean light originating from the sun, also called irradiance. With artificial light we mean light originating from artificial light sources, also called lamps. Below we will shortly address both types of light in the context of indoor environments with windows and interiors containing objects and light sources.
Indoor natural light
During daytime, light indoors is usually a mixture of sunlight and artificial light, depending on the time of the day. The share of sunlight entering a room depends on the surface area of its windows, their orientation, and the degree of overcast [25], as well as the geographic location, the season (the date), and the time of the day.
Solar irradiance that enters a room is dependent on the distance between an open aperture – a window – and the point of observation, and the obscuration by the open aperture. In cases of large windows over the whole width of a room, the attenuation – the gradual loss in the intensity of solar irradiance – is mainly caused by the distance to and the reflectance of the window. The overall irradiance level therefore depends on the architecture of the building, and interior characteristics like the surface reflectance of the walls, ceiling, and floors.
Generally, the irradiance levels outdoors in northern Europe at mid-summer range between 1000 W/m2 irradiance at a clear day and around 325 W/m2 at a diffuse day/overcast [26]. Irradiance levels indoors are significantly lower, because the amount of transmitted light through a windowpane broadly depends on the type of glass, cover materials, size, and type of frame. Literature shows that at a distance of 1 m from a single glazing, the radiant power has reduced below 40% of the outdoor measured value, leading to values of 400 and 130 W/m2 for a clear and an overcast day, respectively. At a greater distance, for example, 5 m from the window, the radiant power decreases even more, reaching 93% of the value outdoors. In case of a double-glass insulated window, the decrease in the radiant power at 1 and 5 m from the window will be around 70% and 97%, respectively [9, 27].
Indoor artificial light
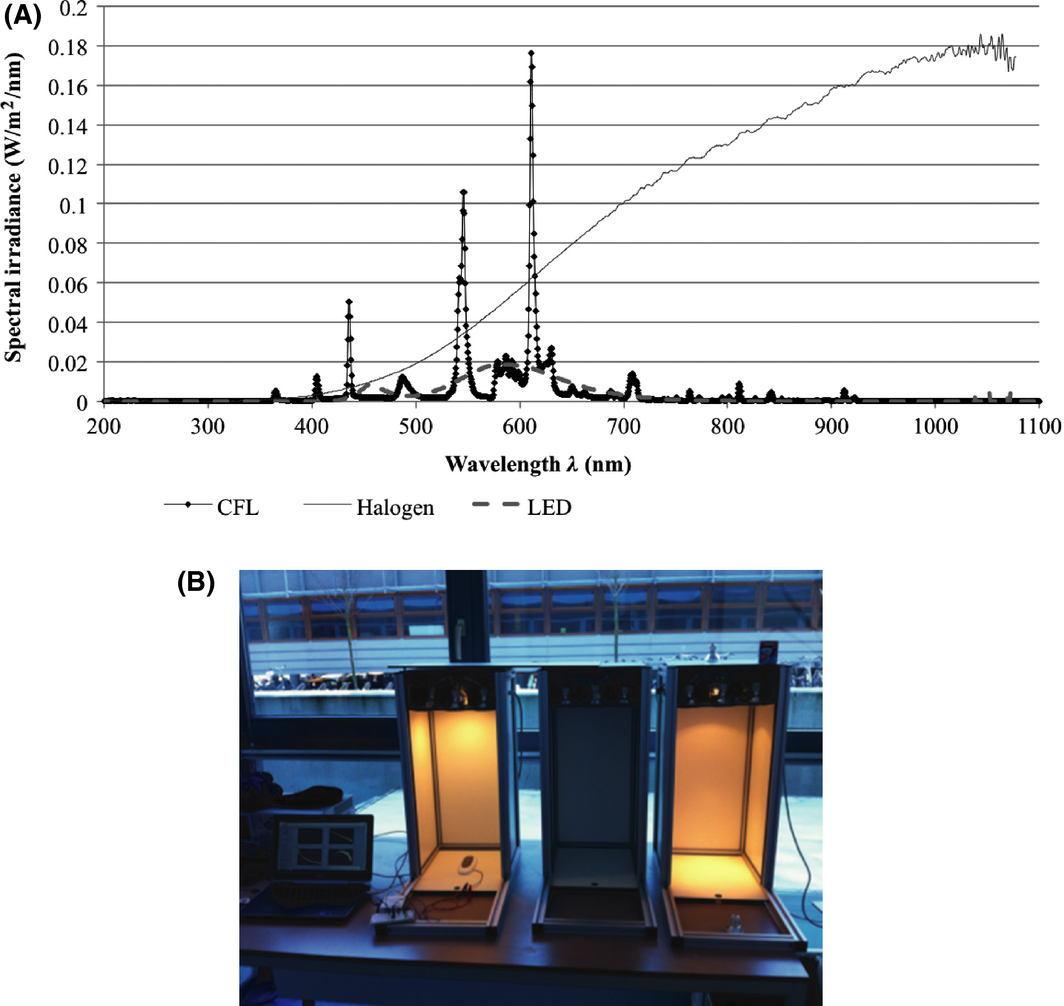
When natural light indoors is inadequate, artificial lights can provide additional light. The irradiance then depends on the amount, sort, and location of the lights that are turned on. Typical artificial light sources are CFL, LED, and incandescent lamps. Figure 3 presents the light spectra of three types of artificial lighting: CFL lamp (Megaman compact reflector GU10, BR0709i, 9 W, 78 mA, 220–240 V, 50/60 Hz, 3000 K Warmwhite), LED (Gamma 230 V–50 Hz, 4.2 W), and halogen lamp (Twistalu, Philips B9, 35 W, 230 V, 40D).
|
|
|
Figure 3. (A) Spectral irradiance of CFL, LED, and halogen lamp in W/m2/nm. Measurements taken at the Applied Labs of TU Delft on 21 January 2014, and (B) the experimental setup that was used for the measurement of the lamps' spectrum. |
Each light source (halogen, LED, and CFL) was mounted inside a specially designed box with dimensions 67 × 30 × 30 cm. The lamps were placed at a distance of 55 cm from the base of the box. The spectroradiometer was placed inside the boxes, so that ambient light from the room could not affect the measurements. The sensor of the spectroradiometer was placed just under the lamp at a distance of 35 cm from it. The spectral irradiance of each lamp was measured using a spectroradiometer (StellarNet Fiber Optic Spectrometer SCal-C10122012, of type Black C-SR-50, BW-16), which was connected to a computer.
It is noticeable that each light radiates at a specific range of wavelength, which is characteristic for the physical functioning of these different lamp types. Since different solar cell technologies have different band gaps and different spectral responses (SRs), they use only a dedicated part of the light spectrum. For example, artificial light emitted by incandescent lamps has a spectral range between 350 and 2500 nm, while an LED has a range of only 400–800 nm2. Lamps like LEDs and CFLs contain most of their power in certain peaks in the visible spectrum between 390 and 700 nm, whereas halogen lamps radiate a considerable amount of their power in the infrared region of the spectrum. This means that depending on the technology of the solar cells, exposure to different light technologies results in different efficiencies and power output by these solar cells.
Model Description
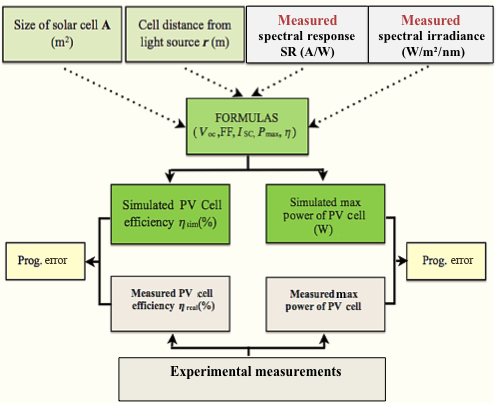
With the objective to estimate the performance of PV products' cells indoors, an analytical model was created in Microsoft Excel. The model combines measurements of natural and artificial irradiance in several rooms, with literature data and measured data regarding the performance and the SR of PV technologies under low irradiance levels, that is, below 1000 W/m2 [11-13, 28-30]. The input data of the model are the surface of the solar cell (in m2), the measured SR (in A/W under STC) of the PV technology that is used by a certain PV product, the measured mixed indoor irradiance (in W/m2/nm), and solar cells distance from light sources (in m). The model executes spectrally distributed calculations and delivers solar cells efficiency and power produced (in W) under specific indoor conditions (Fig. 4). Finally, the simulated results of the efficiency and maximum power of the PV products' cells are compared with the measured values of efficiency and power of the PV cells using their measured I-V curves. This later step is executed to assess the models accuracy.
|
|
|
Figure 4. Schematic depiction of the analytical model created for the estimation of the performance of PIPV cells indoors [4, 31]. |
Mathematical equations
Equation (1) gives the general formula for the calculation of the efficiency η of a solar cell:
|
|
(1) |
where Isc is the short circuit current (in A), Voc the open circuit voltage (in V), FF the fill factor (−), Pmpp the measured power in the maximum power point (mpp) (in W), and Pin the power (in W) of the irradiance hitting a solar cell. The FF was calculated by equation (2):
|
|
(2) |
where the “mpp” values are the maximum power point values (Impp [in A]: current at the maximum power point, and Vmpp [in V]: voltage at the maximum power point), which is also the maximum output of the solar cell. The Isc is the short circuit current and Voc the open circuit voltage.
Using the Shockley equation in one-diode model (3), it can be assumed that ideally, the short circuit current ISC is equal to the photocurrent IPh [32-34].
|
|
(3) |
where J is the current density produced by the solar cell (A/m2), Jo the saturation current density (A/m2), Jph the generated photocurrent density (A/m2), e the elementary charge (1.60217662 × 10⁻¹⁹ Coulomb), V the applied voltage across the terminals of the diode (V), kB the Boltzmanns constant (1.3806488(13)×10−23 J/K), and T the temperature (K).
The short circuit current ISC is calculated using equation (4).
|
|
(4) |
where is the spectral irradiance (W/m2 nm) and is the SR of the solar cell (A/W).
|
|
(5) |
where Enatural is the spectral irradiance indoors originating from the sun (in W/m2nm), and Eartificial the spectral irradiance indoors originating from artificial lights (in W/m2nm). The integral of the short circuit current from 191 to 1076 nm wavelength is the total short circuit current of the cell. The range in which the measurements were conducted is defined by the wavelength range of the measurement equipment – the spectroradiometer. The specific spectroradiometer can measure irradiance (in W/m2) in a range of 185 and 1078 nm. For our measurements, we have chosen a wavelength range from 191 to 1076 nm due to irregularities of the measurements around the edges (e.g., above 1000 nm there was high infrared radiation). A presentation of results in this range does not affect the accuracy of the measurements and the calculation of the short circuit current of the PV cell.
Modeling of the indoor irradiance
Due to the small size of artificial lights compared to their distance to a PV products cells, we assume in our model that lamps are point sources. Therefore, the irradiance at each point can be calculated using equation (6), which follows the inverse square law.
|
|
(6) |
where Irps is the irradiance at a specific distance from the lighting source (W/m2), Ips is the intensity (luminous or radiant power per unit solid angle) of the lighting source (W/sr), and r is the distance of the object from it (m). However, equation (6) cannot be used in case of linear light sources, such as fluorescent light tubes.
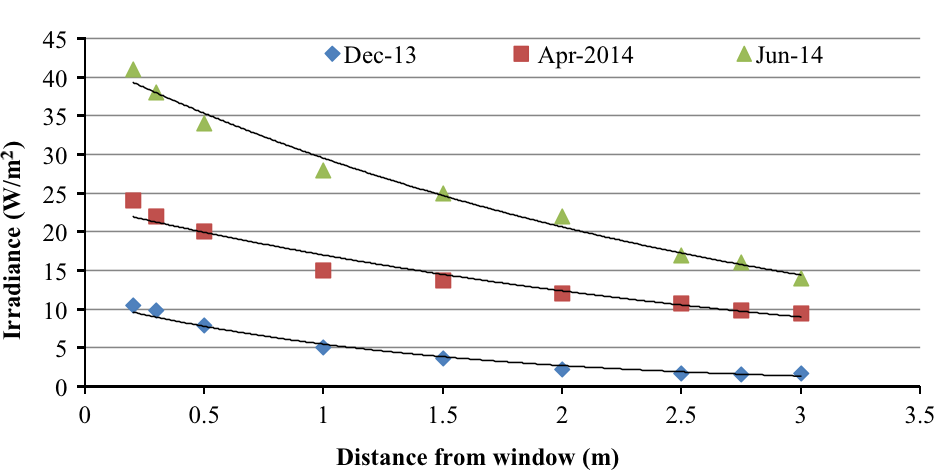
For the investigation of indoor natural irradiance, associated with the distance from windows, multiple measurements were performed in an office and a workshop at TU Delft. Figure 5 depicts the results after 3 days of measurements at a north-oriented office. The specific orientation was chosen as the worst case scenario (less irradiance during the day) and also due to its availability to conduct tests there.
|
|
|
Figure 5. Irradiance measurements conducted on three different days: 3 December 2013, 2 April 2014, and 4 June 2014 at a north-oriented office, TU Delft, the Netherlands [4, 31]. |
On 3 December 2013, the measured irradiance outside of the window of the office was 37 W/m2, on 2 April 2014 it was 91 W/m2, and on 4 June 2014 it was 146 W/m2. The orientation of the measurement device (in this case a spectroradiometer) during the measurements was horizontal (placed flat on a table). In Figure 5, the distance-to-window rule is described as indicated by equation (7).
For the measurements that are presented in Figure 5, no solar cell was used. More specifically, a spectroradiometer was used, which was placed at different distance from the window. Artificial lighting is not used during this test. At each position of the spectroradiometers sensor, we got one measurement. Figure 5 presents the indoor irradiance as measured, including possible reflections, transmissions, etc. In the model we do not account the reflections and transmissions because it is not possible. The transmissions and reflections of irradiance differentiate broadly in each case. Thus, it is not possible to be calculated or even predicted. The only reflection that can be assumed is the one coming from the windows glass.
The measurements exposed that the irradiance changes approximately with the reciprocal of the distance:
|
|
(7) |
where Irs is the irradiance at a specific distance from the lighting source (W/m2), Is is the intensity (luminous or radiant power per unit solid angle) of the lighting source (W/sr), and r the distance (m).
Equations (6) and (7) are used for the calculation of the irradiance at a specific distance from the artificial light sources and windows.
Experiments
Measuring I-V curves of PV cells
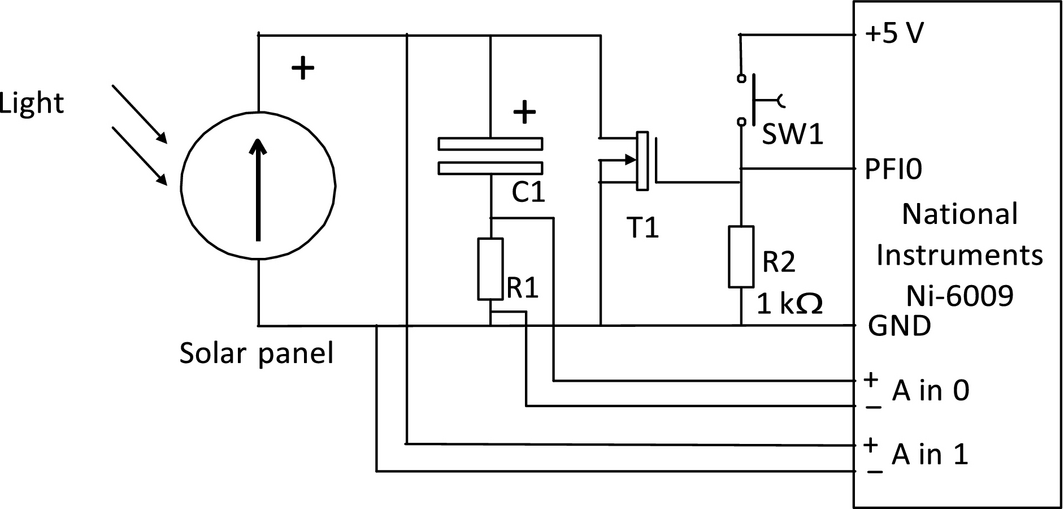
The equipment used for the measurements of the PV products' cells' performance (I-V curves) include a data acquisition module and an electronic circuit (Fig. 6). The I-V measurement setup is in-house designed by Martin Verwaal at the Applied Labs of the Industrial Design Engineering department of Delft Technical University. This circuit consists of a charging capacitor (C1) with low series resistance, ranging from 10 to 1000 μF, a current measuring resistor (R1) ranging from 1 to 100 Ω, a discharging MOSFET BUK9535 (T1), and a start switch (SW1). The MOSFET has a low ON resistance (<35 mΩ at Vgs = 5V). Resistor R2 is 1 kΩ and it is added to keep the gate of the MOSFET in the normal state at a low level, so the MOSFET is not conducting.
|
|
|
Figure 6. Circuit diagram used for the measurement of I-V curves. |
First, the PV cell of the product has to be disconnected from the products' electronic circuit and connected to the measuring circuit. The capacitor is discharged through the MOSFET by pressing switch SW1. The capacitor is initially emptied (at 0 V). When the switch is released, the PV cell recharges the capacitor. Voltage in the capacitor does not sweep from zero to Voc, but the capacitor is charged until the Voc. At the same time the data acquisition module records the solar panel voltage and charging current. A Labview program controls the measurement and presents the I-V curves of the tested PV cells.
Measurements were taking place under mixed indoor lighting conditions and with solar cells of various types. Therefore, the size of the capacitor and the value of the current measuring resistor had to be adjusted each time. For indoor measurements, it proved to be very important to integrate measurements over 1 or more power line cycles (multiples of 20 msec) due to the flickering of the artificial light sources. The value of the current measuring resistor was kept as low as possible, but high enough to keep the accuracy below 0.1% of the total range. In our case, the measuring range was 100 mV, which gives an accuracy of 100 μV. For example, in order to get a measuring range of 10 mA, a resistance of 10 Ω was used. The accuracy in the current measurement was 1% of the measured value, as well as the accuracy of the measuring resistor (1%). The absolute voltage accuracy was 0.1% of the range (10 mV). The rate of the measurement depends on the PV cell and the capacitor and it is estimated to be in a range of 100 msec to 10 sec.
Measuring indoor irradiance
Spectrally distributed measurements of indoor irradiance were conducted in offices and laboratories of the Department of Design Engineering of TU Delft in the Netherlands. Natural light and three types of artificial light sources, as described in “'Indoor artificial light'” section, compact fluorescent lamp (CFL), LED, and halogen lamp were measured. A StellarNet Fiber Optic Spectroradiometer, type Black-Comet-SR, model C-SR was used for the measurements of spectrally distributed irradiance of both natural and artificial lighting. The accuracy of the instrument is 5%, with bandwidth 0.5 nm and wavelength range of 190–1080 nm. It contains a probe for a CR2 miniature cosine receptor for UV-VIS-NIR.
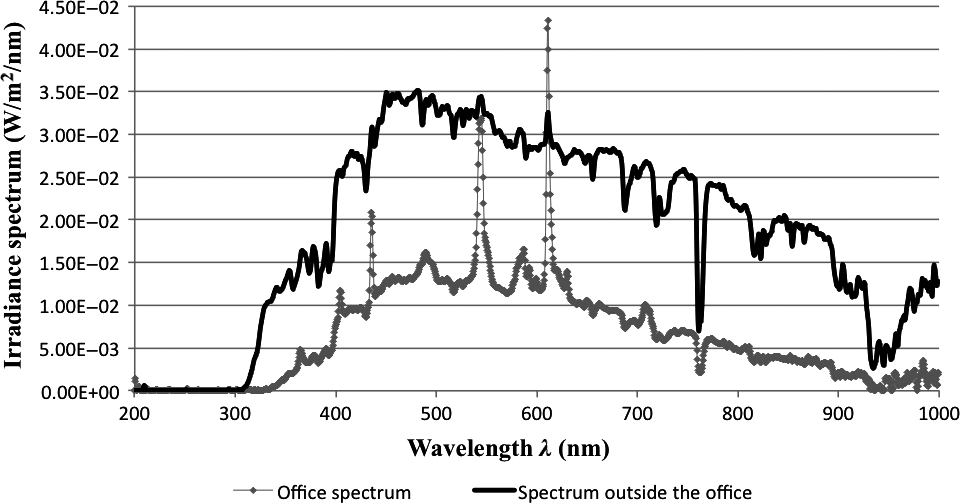
Figure 7 depicts the irradiance spectrum indoors, at an office environment, under mixed light (natural light indoors and artificial light by CFL lamps 58 W, light color 830 Warmwhite, Philips Master TL-D, 58W/830), and the spectrum of light outdoors, just outside the window of the specific office. Both measurements were conducted at the same time. The sensor was placed horizontally during both measurements, indoors and outdoors, at a distance of 50 cm inside and outside the window, respectively. For the outdoor measurements of irradiance, we used the spectroradiometer and we placed a cover on the top of the sensor (CR2-AP ~4.8%, cosine receptor 2 – aperture ~4.8%), which lets only a very small percentage of solar irradiance through (namely ~4.8% of the total irradiance). The cosine receptor CR2 has a wavelength of 200–1100 nm, diameter 1/4 inches, and field of view 180°. Total irradiance outside the office was measured around 33 W/m2, while indoor irradiance was around 10.5 W/m2. It is interesting to notice the difference between these two spectra, regarding their values. The window glass (double glazing) cuts almost two thirds of the measured outdoor irradiance and permits only one third of it to pass indoors. The glass manufacturer is Glaverbel, and the type is Thermobel 0.5 Stopray. Stopray means that there is a triple silver coating that stops direct IR sunlight with around 80% and lets the visible sunlight through.
|
|
|
Figure 7. Irradiance measurements indoors under mixed indoor lighting and outside the window at the Applied Labs of TU Delft, the Netherlands, on 21 January 2014. |
Observing the curve that depicts the outdoor spectral irradiance, we can see only the spectrum of natural light, while indoors the curve seems to contain both natural light that enters the room, as well as artificial light originating from fluorescent lamps. The existence of artificial fluorescent light is clear, due to the peaks of the curve at specific wavelengths, some of which are at the 437, 547, and 612 nm, typical characteristic of the specific light.
External quantum efficiency and SR measurements
Measurements were conducted for the calculation of the PV cells' SR under standard test conditions (STC). For that purpose, we used a built-in house setup of the Photovoltaic Materials and Devices (PVMD) group at TU Delft. This setup consisted of a Newport illuminator/monochromator, a probes' holder, a chopper, and a lock-in amplifier. The PV cell of each product was placed at a stable position and at a distance of around 2 m from the monochromatic light source to measure the external quantum efficiency (EQE). The measured EQE at this stage of the procedure was not at STC. In order to calculate the EQE and consequently the SR of the tested PV cells at STC, we also used a solar simulator calibrated at AM1.5 (Super Solar Simulator WACOM, Model WXS-90S-L2, AM1.5GMM, Serial No. 07061501, 1φ, 230V, 18A) for the calculation of the short circuit current ISC of the solar cells of each product. Using the correlation of the short circuit current under STC and under the monochromatic light, we calculate the EQE at STC and from there the SR at STC, using equations (8) and (9).
|
|
(8) |
where EQE is the external quantum efficiency and JSC is the short circuit current density (mA/cm2) at STC and under the monochromatic light measurements (mon.light).
The SR of the PV products' cells is calculated by equation (9):
|
|
(9) |
where SR is the spectral response of the solar cell (A/W), EQE is the external quantum efficiency, λ is the wavelength (nm), q the elementary electric charge (~1.6 × 10⁻¹⁹ C), h is Plancks constant (~6.626 × 10⁻³⁴ Js), and c the speed of light in vacuum (m/sec). As equations (8) and (9) show, the EQE and SR are wavelength dependent. EQE is dependent on the JSC (see eq. (8)), which also depends on the wavelength.
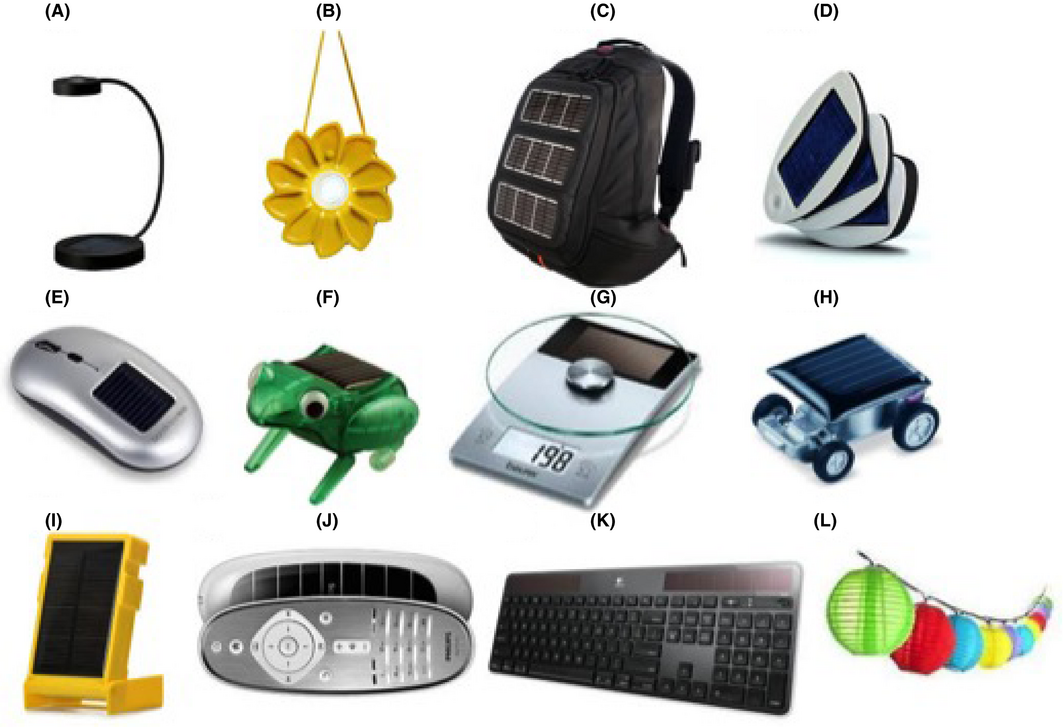
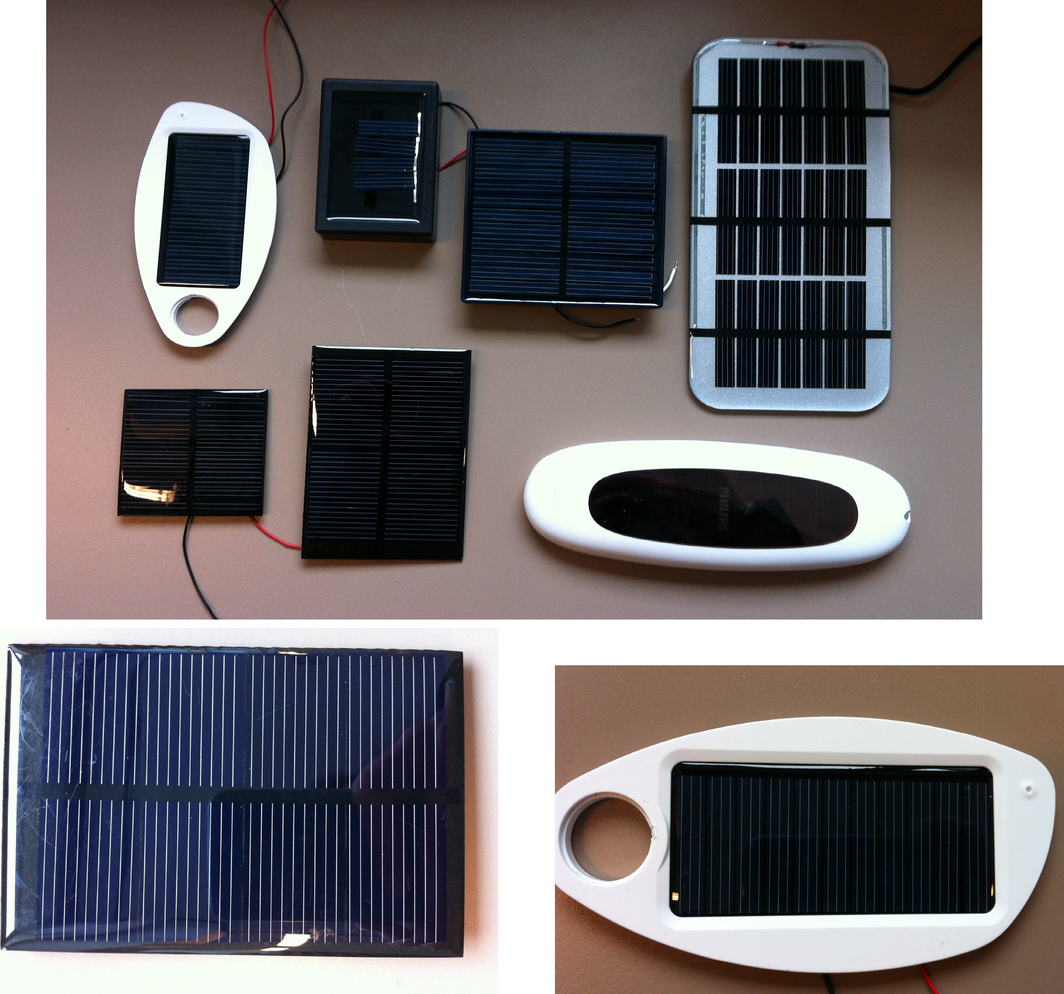
The PV products that were tested using the above-described equipment are illustrated in Figure 8.
|
|
|
Figure 8. Tested PV products: (A) IKEA Sunnan lamp, (B) Little Sun solar-powered lamp, (C) Voltaic solar bag, (D) Solio charger, (E) solar mouse by Bondidea, (F) frog toy, (G) PV kitchen weight scale, (H) car toy, (I) WakaWaka light, (J) Philips remote control, (K) solar wireless keyboard by Logitech, (L) Ranex lights (figures attached from Google). |
The PV cells are tested including encapsulant material and contacts. Figure 9 illustrates a sample of the tested products' PV cells, as used during the measurements. Dissimilarities in measured and simulated values are a result of the damages in PV cells surface, the PV cells' connection, the type of the coating material, or lesions of the PV cell.
|
|
|
Figure 9. Some of the tested products' PV cells, as used during the experiments. |
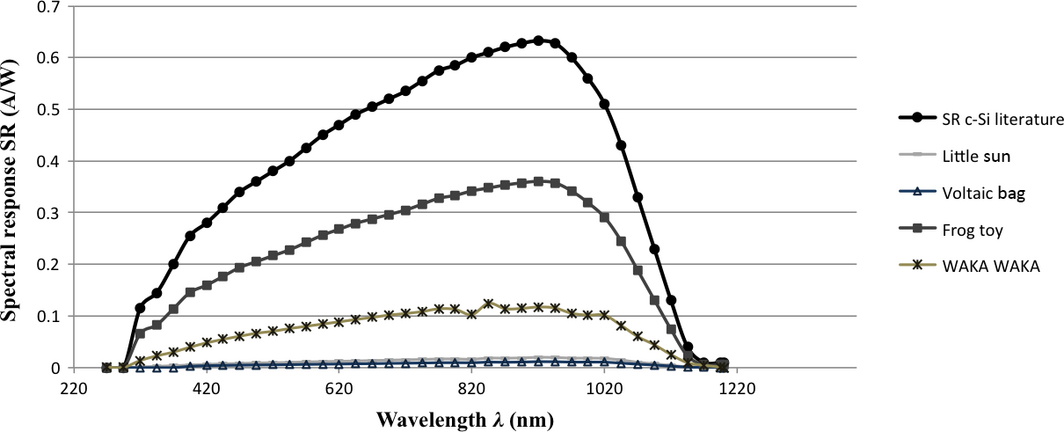
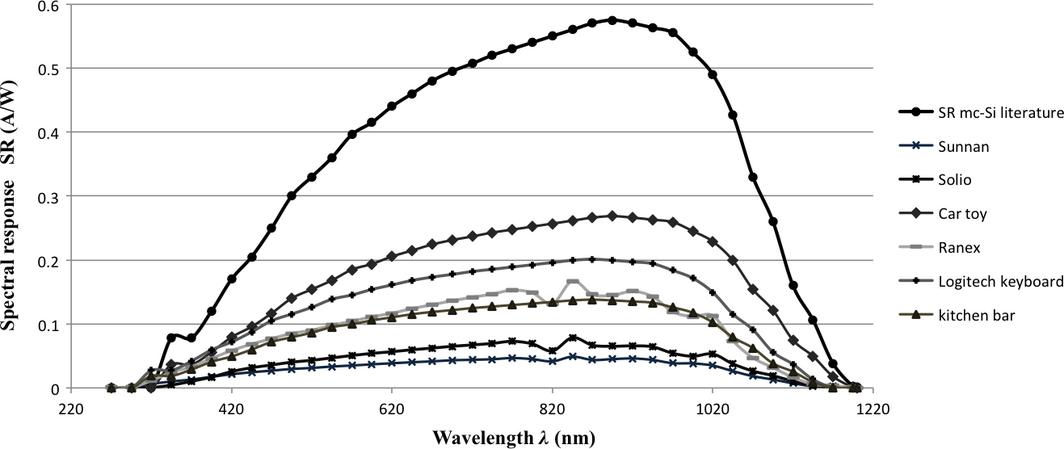
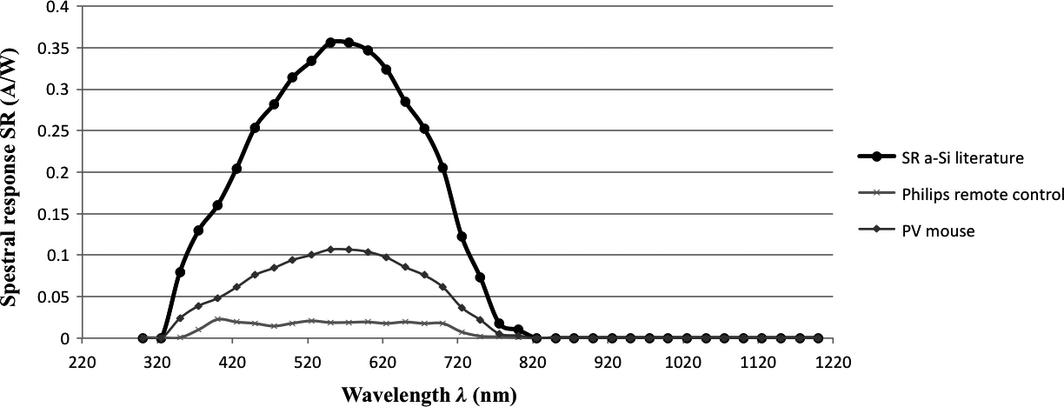
Figures 10, 11, and 12 present the results from the measurements of the SR data for c-Si, mc-Si, and a-Si cells at STC, respectively. The literature-reported SR of each technology, at irradiance levels between 1 and 1000 W/m2 [13], is also included in Figures 10, 11, and 12, as well as the measured SR of each one of the products' PV cells.
|
|
|
Figure 10. Spectral response of c-Si cells as reported in literature [13], and measured for the tested PV products [4, 31] under STC. |
|
|
|
Figure 11. Spectral response of mc-Si cells as reported in literature [13], and measured for the tested PV products [4, 31] under STC. |
|
|
|
Figure 12. Spectral response of a-Si cells as reported in literature [13], and measured for the tested PV products [4, 31] under STC. |
Figure 10 presents the SR of the c-Si cells, as measured at STC, for 4 PV products: the Little Sun light, the Voltaic bag, the frog toy, and the WakaWaka light. There is also one extra line in the graph, which depicts literature data for the SR of c-Si. It is noticeable that the literature-reported SR of c-Si is far higher than the measured values. In reality, the SR of the cells that consumer PV products use could hardly compare with the SR of the laboratory fabricated PV cells intended for larger applications. Furthermore, even PV cells of the same technology, which are fabricated by other manufacturers, could have deviations in their SR, as it is broadly influenced by the transmissions and reflections of the cells surface.
The SR of the frog toys PV cell is the highest among the other cells and reaches around 57% of the literature data of SR for c-Si. The lowest SR is noticed for the Little Sun light and the voltaic bag, which seem to be less than 3% of the literature values.
Figure 11 presents the SR of mc-Si cells and includes seven lines: one for the literature-reported SR of mc-Si and six lines, which depict the SR of six commercial PV products that use mc-Si cells. These products are the Sunnan light, the Solio charger, the car toy, the Ranex lights, the Logitech keyboard, and the kitchen weight bar. The literature-reported SR of mc-Si is the highest compared to the products' values. The SR of the car toy reaches around 46% of the literature data for the mc-Sis SR, while the lowest value among the tested products is the one of the Sunnan lamp, which is around 8% of the literature value.
Figure 12 presents the SR of a-Si cells. It includes three lines: one for the literature-reported SR of a-Si cells and two lines, which depict the SR of two commercial PV products – the Philips remote control and the PV-powered mouse. Between the two products, the Philips remote control has the lowest SR, which is around 7% of the literature data for the SR of a-Si cells.
Looking at the SR curves of the Figures 10, 11, and 12, it arises that at wavelengths below 400 nm, the PV cell absorbs most of the incident light and therefore the SR of the cell is low. At wavelengths 400–1000 nm the cell approaches the ideal, while at wavelengths above 1100 nm the SR significantly decreases, finally falling down to zero.
Results
The model described in “'Model Description'” section was applied twice (first and second simulations). In order to clarify the differences between the two simulations, in Table 1 we present the inputs, variables, and measurements that took place during the first and the second simulations. As Table 1 shows, for the first simulation we measured the spectral irradiance indoors with the equipment described in “'Measuring indoor irradiance'” section, as well as the current–voltage (I-V) curves of the products' PV cells under mixed indoor light, using the equipment described in “'Measuring I-V curves of PV cells'” section. The inputs of the model for the first simulation were the literature data of the SR of c-Si, mc-Si, and a-Si cells [13], the measured indoor irradiance, the surface of the PV cell, and its distance from the artificial and natural light sources. The outcomes were the calculation of the maximum power and the efficiency of the PV cells. Finally, the models outcomes are compared with the results of the maximum power and efficiency of the cells, as derived from the measurements, and the model error is calculated.
| Simulations | Measurements | Inputs | Variables |
|---|---|---|---|
| First simulation |
|
|
|
| Second simulation |
|
|
|
For the second simulation, extra measurements took place (see Table 1). At this stage except from the indoor irradiance and the I-V curves of the tested PV products' cells, we also measure the EQE and the SR of each PV cell at STC, using the equipment described in “'External quantum efficiency and SR measurements'” section. The inputs of the model are the same as in the first simulation with one important difference; for the second simulation, we use as input the measured SR of the PV cells at STC and not the literature data. The models outcomes are the maximum power and efficiency of the PV cells, which are again compared with the measured values.
The purpose of these two simulations is to understand the role of the SR in the performance of a solar cell and the big deviations of the measured values compared to the literature data.
For the simulations, it is important to clarify that the active solar cell surface is standardized for all the PV products at 10 cm2. All PV products' cells were tested at a of distance 50 cm from the window and the cells were horizontally placed during the measurements (flat on a table). During the first simulation, the estimation of the fill factor and the open circuit voltage was done according to the irradiance levels on the cell. The necessary data for this calculation were obtained from measurements performed by Randall (2001). By processing the data in Excel, logarithmic equations were found that best fit the experimental results. It was calculated that according to Randall (2001), the voltage depends on the irradiance based on the following relation: VOC = 0.045 ln(E) + 0.2931, with R2 = 0.98572. This is a linear variation on a logarithmic scale. Using this equation, the program computes the Voc that corresponds to the irradiance reaching the surface of the cell. The Voc, for the second simulation, was measured for each PV products solar cell using the I-V curve measurement setup that was described in “'Measuring I-V curves of PV cells'” section.
There exist several reasons to present results from simulations using real solar cells adding to simulations based on theoretical values of solar cells from literature, namely:
- We would like to show the performance of real solar cells in commercially available PIPV to show experts in the field of energy technologies, in particular PV researchers, that a lot of improvement can be made in increasing the performance of PIPV by using solar cells with a better performance, better said with a higher efficiency.
- Second, to show product designers that the use of literature data of variables such as SR, cells' efficiencies, etc., during the design process of a PV product may result in assumptions that would not comply with the reality. If using literature data, the assumptions and calculations regarding the performance of the designed product will be too positive.
By showing the difference between simulations based on data from literature and data from existing cells, we provide valuable information to researchers and product designers.
Table 2 presents the cells of the tested PV products, as used in the measurements. The table illustrates the PV cells of each product, it presents the PV technology of each cell, as well as the short circuit current, the open circuit voltage, and the maximum power of each cell, as measured using the equipment described in “'Measuring I-V curves of PV cells'” section. The values of ISC, Voc, and Pmpp that are presented in this table are measured under fluorescent light. It can be seen from equation (5) that ISC depends on the available light spectrum. Besides, the short circuit current differs for each type of PV technology, as each material has different SR and solar cells have different surface area. These factors greatly explain the variation of a PV cells performance under different types of illumination.
| PV products' cells | Product name | PV cell type | Full cell area (cm2) | ISC (mA) (under CFL light) | VOC (V) (under CFL light) | Pmpp (mW) (under CFL light) |
|---|---|---|---|---|---|---|
| Sunnan | mc-Si | 57 | 0.57 | 2.56 | 0.62 | |
| Little Sun | c-Si | 36 | 0.35 | 3.22 | 0.62 | |
| Voltaic bag | c-Si | 87 | 0.49 | 6.54 | 1.65 | |
| Solio | mc-Si | 17 | 0.31 | 3.7 | 0.58 | |
| Frog toy | c-Si | 4.8 | 0.24 | 0.52 | 0.076 | |
| Philips control | a-Si | 30 | 0.27 | 5.37 | 0.77 | |
| Car toy | mc-Si | 2.7 | 0.31 | 0.24 | 0.041 | |
| WakaWaka | c-Si | 65.7 | 1.4 | 1.45 | 1.1 | |
| Ranex | mc-Si | 8.1 | 0.63 | 1.62 | 0.6 | |
| Logitech keyboard | mc-Si | 35.24 | 0.32 | 4.7 | 1.64 | |
| PV mouse | a-Si | 9.53 | 0.09 | 6.9 | 0.41 | |
| Kitchen bar | mc-Si | 44 | 0.32 | 6.1 | 0.96 |
First simulation
For the first simulation, the model has been applied by using the SR as given in the literature [13], as it is also discussed in the introduction of “'Results'” section. The measurements and results presented in Table 3 were conducted on 21 January, 26 September, and 3 October 2014. The measured spectral irradiance on 21 January 2014 outside the window of the office, where the PV products were tested, was around 33.4 W/m2. Indoors, at the laboratory the irradiance was ranging between 8 and 12 W/m2, and composed of a mixture of artificial fluorescent light and natural light. On 26 September and 3 October 2014, the measured irradiance at the laboratory was ranging between 10 and 13 W/m2 (see Table 3).
| PV product | Product function | PV cell type | Total irradianceb (W/m2) | Measured Pmax (mW) | Simulated Pmax (mW) | Measured efficiency η (%) | Simulated efficiency η (%) |
|---|---|---|---|---|---|---|---|
| |||||||
| Sunnan | Lighting | mc-Si | 9.9 ± 0.5 | 1.2 ± 0.5 | 1.0 ± 0.3 | 2.1 ± 0.2 | 3.8 ± 1.1 |
| Little Sun | Lighting | c-Si | 10.2 ± 0.5 | 1.2 ± 0.6 | 1.5 ± 0.5 | 4.0 ± 0.2 | 6.2 ± 1.9 |
| Voltaic bag | Charger | c-Si | 8.6 ± 0.4 | 3.7 ± 0.5 | 2.3 ± 0.7 | 5.4 ± 0.5 | 6.0 ± 1.8 |
| Solio | Charger | mc-Si | 10.2 ± 0.5 | 0.8 ± 0.2 | 0.9 ± 0.3 | 4.5 ± 0.1 | 3.8 ± 1.1 |
| Frog toy | Moving | c-Si | 10.2 ± 0.5 | 1.3 ± 0.7 | 1.8 ± 0.5 | 6.4 ± 0.2 | 7.3 ± 2.2 |
| Philips control | Charger | a-Si | 10.5 ± 0.5 | 0.8 ± 0.4 | 1.7 ± 0.5 | 2.5 ± 0.1 | 7.0 ± 2.1 |
| Car toy | Moving | mc-Si | 10.5 ± 0.5 | 1.1 ± 0.3 | 1.4 ± 0.4 | 5.8 ± 0.1 | 6.0 ± 1.8 |
| WakaWaka | Lighting | c-Si | 10.9 ± 0.5 | 0.8 ± 0.3 | 1.5 ± 0.5 | 1.2 ± 0.1 | 4.2 ± 1.3 |
| Ranex | Lighting | mc-Si | 9.5 ± 0.5 | 0.3 ± 0.1 | 0.5 ± 0.1 | 3.6 ± 0.04 | 3.6 ± 1.1 |
| Logitech keyboard | Entertainment | mc-Si | 11.5 ± 0.5 | 3.3 ± 0.1 | 4.1 ± 0.3 | 10.7 ± 0.1 | 10.9 ± 1.1 |
| PV mouse | Entertainment | a-Si | 10.5 ± 0.5 | 0.7 ± 0.2 | 1.2 ± 0.5 | 6.2 ± 0.1 | 7.3 ± 2.3 |
| Kitchen weight bar | Cooking | mc-Si | 10.5 ± 0.5 | 1.2 ± 0.4 | 1.7 ± 0.6 | 3.6 ± 0.6 | 5 ± 1.6 |
Table 3 shows the measured and simulated results for the maximum power Pmax (mW) and efficiency η (%) of the tested PV products' cells under mixed indoor irradiance. It indicates that the simulated efficiency of the PV products' cells during the first simulation was exceeding the measured value. From Table 3, it seems that a well-performing PV product under low indoor irradiance is the solar keyboard, for which the measured and simulated efficiency is 10.7% (±0.1) and 10.9% (±1.1), respectively. Other sufficiently performing products indoors are the frog toy with measured and simulated efficiency 6.4% (±0.2) and 7.3% (±2.2), respectively, and the PV-powered mouse with 6.2% (±0.1) and 7.3% (±2.3), respectively. On the other hand, bad-performing PV products for use at low indoor irradiance are the Philips remote control with measured and simulated efficiency 2.5% (±0.1) and 7.0% (±2.1), the Sunnan lamp with 2.1% (±0.2) and 3.8% (±1.1), and the WakaWaka light with 1.2% (±0.1) and 4.2% (±1.3), respectively. The measured results that are presented in Table 3 were conducted using the equipment described in “'Measuring I-V curves of PV cells'” section.
The results show that the model can predict the efficiency of the PV products' cells under mixed indoor irradiance with a typical inaccuracy of around +30% (see Table 3). Besides, except from the irradiance, it seems that there are other factors that influence PV cells' performance under mixed irradiance conditions. In order to define these factors and succeed a more accurate result, we continued with the second round of simulations of our model, where we measured the specific SR of the products' cells.
Second simulation
During the second simulation, we used the SR as measured under STC, for the 12 different PV products cells, instead of literature data. Other inputs of the model for the second simulation were the measured indoor irradiance, the surface of the PV cell, and its distance from the artificial and natural light sources, as discussed in the introduction of “'Results'” section. The measured values of the SR of the c-Si, mc-Si, and a-Si cells were significantly lower than that reported in literature, as it is also presented in Figures 10, 11, and 12.
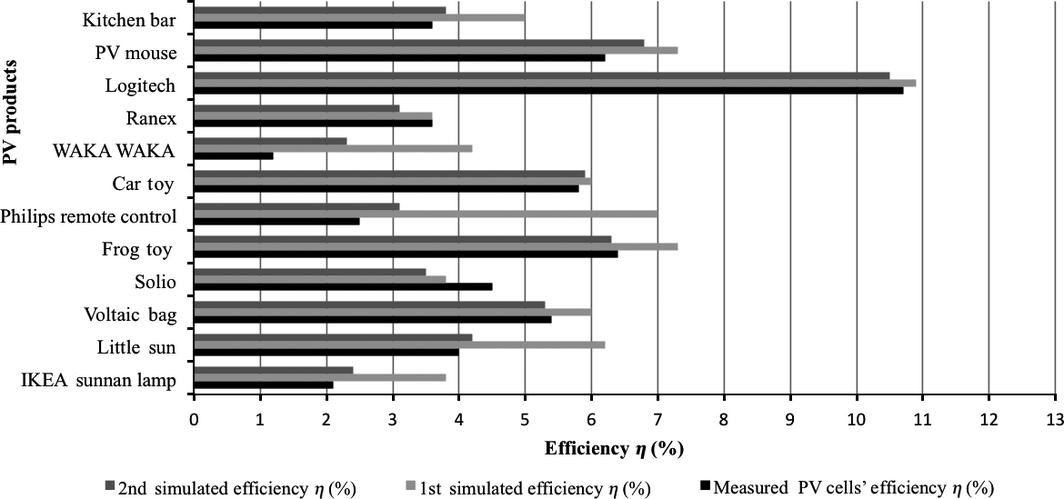
As Figure 13 demonstrates the PV cells' efficiency resulting from the second simulation was lower than the values of the first simulation, and they slightly deviated from the measured efficiency. The lesser the SR of a PV cell, the lower the short circuit current and the lower the cell efficiency. In Figure 13, the measured and the simulated PV cells' efficiency for the tested PV products are presented for the first and the second simulation round. The Philips remote control seems to have the biggest deviation of PV cells' efficiency between the first and the second simulation, which ranges from 7% to 3%, respectively. This deviation is a result of the SR of the products PV cells (a-Si), whose measured SR is significantly lower (<10%) than the literature data [13] (see Fig. 12). Other products with big deviations between the first and the second simulated efficiency are the Little Sun light, with 6.2% efficiency during the first round and 4.2% for the second simulation, and the WakaWaka light, with 4.2% simulated efficiency in the first round and 2.3% for the second round, respectively.
|
|
|
Figure 13. Measured and simulated PV product cell efficiency η (%) under mixed indoor lighting, for the first and second simulation [4, 31]. |
As Figure 13 indicates the best-performing PV product is the solar-powered keyboard, with simulated efficiency for the second simulation round around 10.5%, while the measured value is estimated at 10.7%. The frog toy also performs sufficiently with simulated and measured efficiency around 6.3% and 6.4%, respectively. On the other hand, the Sunnan lamp seems to be one of the bad-performing products, with simulated efficiency around 2.4% in the second round of simulations, while the measured efficiency is 2.1%. For the second simulation, results revealed that the model can predict PV cells' efficiency under mixed indoor irradiance with higher accuracy than the first simulation, reaching a typical inaccuracy of approximately +18% (see Fig. 13).
The simulated results show that the model can sufficiently predict the performance of the PV products' cells at an indoor environment. More specifically, the simulated results of the PV cells' efficiency η for mixed indoor light were slightly different from the measured values, with a typical inaccuracy of around 30%. However, the simulated results of the PV cells' maximum power Pmax were even closer to the measured values, with a typical error around 25% (see Table 3). Trying to increase models accuracy, primary conditions (e.g., amount of indoor irradiance, spectrum of artificial light, distance of the PV cells from light sources, and test room) were very specific.
In general, models inaccuracy is a result of some unspecified conditions and features of the products. In detail, an important factor, which is responsible for the low PV cells' performance is the unknown cover material of the PV cell (coating). Each PV cell was surrounded by a plastic surface (cover), whose material is not known. This also results to an undefined transmittance of the cover material. Other factors, which limit down the efficiency of the PV cells, are the orientation of the cell, possible damages on the products surface (e.g., scratches, dust, fingerprints, lesions on the front cover), as well as indoor reflections of irradiance, or shadows in the interior of the room from the surroundings (e.g., furniture, curtains, outdoor shadows, etc.). However, the most important factor, which is responsible for the deviations in results, is the unknown SR of the PV technology that each product uses. The measured SR of the tested PV cells at STC was significantly lower than the literature data of SR for c-Si, mc-Si and a-Si cells (see Fig. 10-12).
Discussion and Conclusions
This article describes a model, which estimates the performance of PV cells at an indoor environment and under mixed indoor light that partially contains outdoor light. The most significant variables in this model are the SR of the PV products cell and the indoor irradiance. The model has been validated by two different simulations: (1) using the SR as given in the literature (under STC) and (2) using the SR as measured (under STC) for 12 different PV products with either x-Si or a-Si solar cells. It is due to the limited research in this field and the related lack of data from other studies regarding modeling of product-integrated PV, the SR of PV cells under mixed indoor lighting, as well as cells' performance under low lighting conditions, that the results of this study could not be compared in full extent with existing findings. However, we assume that now that this basic model exists, students, researchers, and designers can use it to design or evaluate indoor PV products with the purpose to improve their performance. The results of the model are precise enough for product design, using measured SR curves the accuracy is typically in the order of 30%. This is due to the low irradiance conditions, deviations between measured SR at STC and the actual SR at low irradiance conditions, and the bad quality of commercially applied PV cells in PV products.
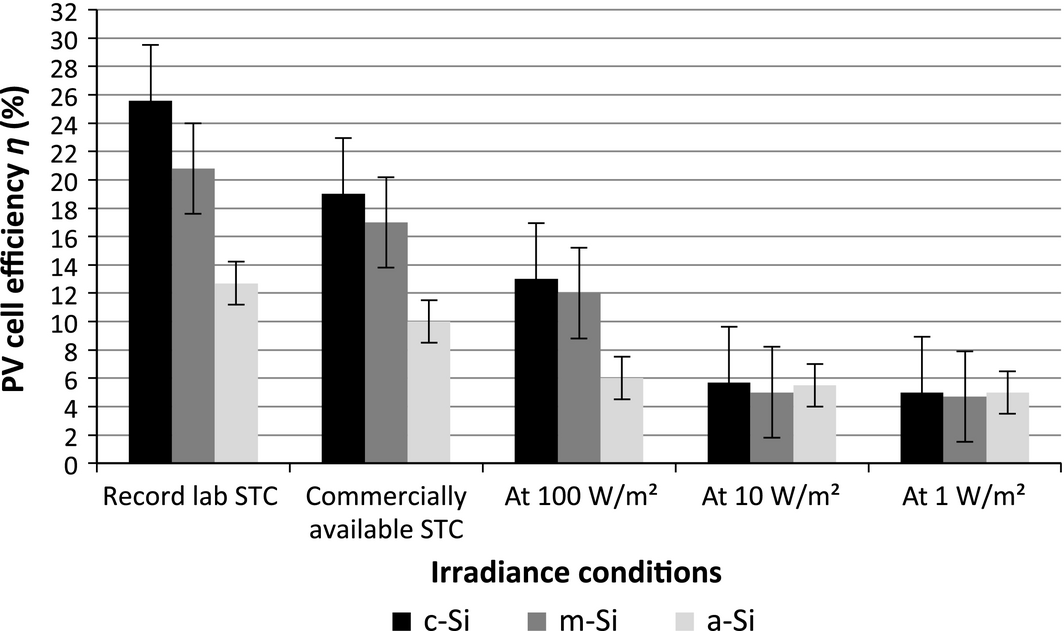
In Figure 14, literature-reported efficiencies are presented for c-Si, mc-Si, and a-Si cells [1, 15, 31, 35]. Figure 14 shows that for mc-Si cells the efficiency at 100 W/m2, which is around 12%, drops significantly at 10 W/m2 down to 5%, whereas the efficiency of a-Si cells seems to be relatively constant around 5–6% at different levels of irradiance. Finally, c-Si cells' efficiency decreased from 13% at 100 W/m2, to 5–6% at 10 W/m2, and 5% at 1 W/m2. The PV cell efficiencies presented in Figure 14 are based on literature (Kan, 2006; Martin A. Green K. E., 2013) and are not outcomes of the authors' research. Based on the literature, the spectrum and temperature of the cells are AM1.5 and 25°C. However, the Rsh seems to be low in the low intensities and therefore the efficiency of the cells is low, too.
|
|
|
Figure 14. PV cell efficiencies of c-Si, mc-Si, and a-Si at different irradiance conditions, respectively, at STC (AM1.5, 25°C, 1000 W/m2), 100, 10, and 1 W/m2 as reported in literature [1, 15, 31, 35], with absolute error ±1%. |
From literature [22-24] it follows that the simulation or modeling of the PV products cells' performance indoors has still not sufficiently been investigated. There are several factors that influence the performance of PV products in an indoor environment, such as the level of indoor irradiance, the performance of the PV cells under low irradiance conditions, the type of illumination [36] the interaction of the user with the product, and the systems energy losses. Therefore, we propose a new simple model capable of predicting the PV performance under various illumination conditions, which would provide basic support during the design of a PV products energy system.
The results of the second set of simulations show that under mixed indoor lighting conditions, the simulated PV cells' efficiency slightly deviates from the measured values, with a typical inaccuracy of around +18%. Additionally, the model practically forecasts a PV products cells performance under artificial illumination, with a typical inaccuracy of around +29% for CFL and LED lighting. Measurements with higher accuracy are quite difficult to obtain, since indoor irradiance reaches just a few tenths of Watts/m2, which is close to the measurement limits of irradiance sensors. Besides, the efficiency of PV cells under these conditions is rather low. The models results hence expose the abovementioned fact and are considered satisfactorily accurate. We have found that under mixed indoor lighting of around 20 W/m2, the efficiency of solar cells in 12 commercially available PV products ranges between 5% and 6% for a-Si cells, 4% and 6% for multicrystalline silicon (mc-Si) cells, and 5% and 7% for the monocrystalline silicon (c-Si).
Figures 10-12 have shown that the SRs of tested PV cells at AM1.5 deviate considerably from literature data. They are typically around 70–80% lower and in some cases even more than 90% less, as presented in “'Experiments'” section. The significantly low SR of commercial PV products' cells happens due to low quality of the cells applied. The cutting of PV cells in small pieces – to be applied in PV products' surfaces – and their condition, for example, soiling of cells surface, possible scratches, cracks, and other damage play a crucial role on the measured SR. Consequently, the use of low quality PV cells leads to PV products with low performance. Furthermore, it is essential to stress here that another reason for the dissimilarities in the SRs is that in this study PV products were not tested as single PV cells, but as assembled devices with several interconnected PV cells (see Fig. 9 and Table 2).
It is also important to be aware of the fact that the SR of the PV cells as measured at STC (1000 W/m2) has been used for modeling at 10 W/m2. This is due to the measurement range of solar simulators, which usually does not cover the very low irradiance range used in our model and due to the unavailability of PV cells' SR data under low irradiance conditions as provided by manufacturers.
Finally, because of our purpose to support designers in their design processes to realize indoor PV products with higher performance than the existing ones, we consider the accuracy of this model as being rather acceptable.
Acknowledgments
The authors acknowledge the Faculty of Industrial Design Engineering (IO) of TU Delft for supporting this research. Besides, we thank Dimitris Deligiannis and Remko Koornneef for their assistance and consultation during the measurements, and the Photovoltaic Materials and Devices group, Faculty of Electrical Engineering, Mathematics and Computer Science (EWI) of TU Delft.
Conflict of Interest
None declared.
References
- Apostolou, G., and A. H. M. E. Reinders. 2014. Overview of design issues in product-integrated photovoltaics. Energy Technol.2:229–242.
- Reinders, A. H. M. E., and van Sark W. G. J. H. M.. 2012. Product-integrated photovoltaics. Pp. 709–732inA. Sayigh, ed. Comprehensive renewable energy, vol. 1. Elsevier, Oxford.
- NOTEBOOK CHECK, Logitech: Wireless Solar Keyboard K760 für Mac, iPad und iPhone. Available at http://www.notebookcheck.com/Logitech-Wireless-Solar-Keyboard-K760-fuer-Mac-iPad-und-iPhone.75344.0.html, von Ronald Tiefenthäler (accessed 30 October 2015).
- Apostolou, G., M. Verwaal, and A. H. M. E. Reinders. 2014. Modeling the performance of product integrated photovoltaic (PIPV) cells indoors. Proceedings of 26th European Photovoltaic Solar Energy Conference (EU PVSEC), Oral Presentation, Amsterdam 2014, The Netherlands, Pg. 3535-3540, DOI: 10.4229/EUPVSEC20142014-6BO.9.5.
- Durlinger, B., A. Reinders, and M. Toxopeus. 2010. Environmental benefits of PV powered lighting products for rural areas in South East Asia: A life cycle analysis with geographic allocation. Proceedings of 35th IEEE PVSC, Hawaii, USA, 2010, Pp. 2353–2357.
- Reinders, A. H. M. E. 2002. Options for photovoltaic solar energy systems in portable products. in I. Horvath, P. Li, J. Vergeest. Proceedings of TMCE 2002, Fourth International Symposium April 22-26, 2002. Wuhan, P.R. China ISBN 7-5609-2682-7.
- Veefkind, M. J. 2003. Industrial design and pv-power, challenges and barriers. in s. n. ed. ISES solar world congress 2003: solar energy for a sustainable future. s.l. ISES.
- Durlinger, B., A. Reinders, and M. Toxopeus. 2012. Life cycle assessment of solar powered lighting products for rural areas in South East Asia, Components for PV Systems, PV System Engineering and Standards, Socio-economic Aspects, and Sustainability. Proceedings of 25th EU PVSEC, Valencia, Spain, 2012, Pp. 3917–3925.
- Kan, S.Y. 2006. SYN-Energy in solar cell use for consumer products and indoor applications. PhD disseration, Final Report 014 –28– 213, NWO/NOVEM, Technical University of Delft, Delft, The Netherlands.
- Apostolou, G., and A. H. M. E. Reinders. 2012. A comparison of design features of 80 PV-powered products. Proceedings of the 27th EUPVSEC, Poster Presentation, Frankfurt 2012, Germany, Pp. 4227–4232, doi: 10.4229/27thEUPVSEC2012-5BV.1.25
- Randall, J. F., C. Droz, M. Goetz, A. Shah, and J. Jacot. Comparison of 6 photovoltaic materials across 4 orders of magnitude of intensity. Proceedings of 17th EUPVSEC, October 2001, Munich, Germany, Pp. 603–606.
- Randall, J. F., and J. Jacot. 2003. Is AM 1.5 applicable in practice? Modeling eight photovoltaic materials with respect to light intensity and two spectra. Renew. Energy28:1851–1864.
- Reich, N. H., van Sark W. G. J. H. M., E. A. Alsema, S. Y. Kan, S. Silvester, van der Heide A. S. H., et al. Weak light performance and spectral response of different solar cell types. Proceedings of 20th EUPVSEC, June 2005, Barcelona, Spain, Pp. 2120–2123.
- Apostolou, G., A. H. M. E. Reinders, and M. Verwaal. 2012. Spectral irradiance measurements in a room fit for indoor PV products. Proceedings of the 27th EUPVSEC, Poster Presentation, Frankfurt 2012, Germany, Pp. 4240–4244, doi: 10.4229/27thEUPVSEC2012-5BV.1.30
- Freunek (Müller), M., M. Freunek, and L. M. Reindl. 2013. Ideal and empirical maximum efficiencies for indoor photovoltaic devices. IEEE J. Photovol.3:59–64.
- Müller, M., J. Wienold, W. D. Walker, and L. M. Reindl. Characterization of indoor photovoltaic devices and light. In: Proc. of 34th IEEE Photovoltaic Specialist Conference. Philadelphia: IEEE, 2009, 738–743, poster award.
- Alsema, E. A., B. Elzen, N. H. Reich, W. G. H. J. M. Sark, van Kan S. Y., S. Silvester, et al. 2005. Towards an optimized design method for PV-powered consumer and professional applications - The syn-energy project. Pp. 1981–1984ins. n. ed. Proceedings of the 20th European Photovoltaic Solar Energy Conference. WIP Renewable Energies, München.
- Reinders, A. H. M. E., J. C. Diehl, and H. Brezet. 2012. The power of design: product innovation in sustainable energy technologies. Wiley, Delft, Netherlands.
- Veefkind, M. J., N. H. Reich, B. Elzen, S. Y. Kan, S. Silvester, M. Verwaal, et al. 2006. The design of a solar powered consumer product, a case study. Pp. 2306–2311inS. n. ed. Proceedings of going green care innovation 2006. International Care Electronics, Vienna.
- Timmerman, M. B.2008. Review of existing knowledge of product integrated PV for industrial design engineers, Internal Research Paper, Master of Sustainable Energy Technology, University of Twente, Enschede, The Netherlands.
- Reich, N. H., M. J. Veefkind, E. A. Alsema, B. Elzen, and vanSark W. G. H. J. M.. 2006. Industrial design of a PV powered consumer application: case study of a solar powered wireless computer mouse. pp. 2306–2311 in S. n, ed. 21st European Photovoltaic Solar Energy Conference, Proceedings of the International Conference. Fraunhofer IWM, München.
- Müller, M., H. Hildebrandt, W. D. Walker, and L. M. Reindl. Simulations and measurements for indoor photovoltaic devices. In: Proc. 24th European Photovoltaic Specialist Conference, Hamburg, Germany: WIP, 2009, Pp. 4363–4367.
- Reich, N. H., van Sark W. G. J. H. M., deWit H., and A. H. M. E. Reinders. Using CAD software to simulate complex irradiation conditions: predicting the charge yield of solar cells incorporated into PV powered consumer products. Oral presentation, Proceedings of 34th IEEE Photovoltaic Specialists Conference, Philadelphia 2009.
- Reich, N. H., van Sark W. G. J. H. M., E. A. Alsema, de Wit H., and A. H. M. E. Reinders. A CAD based simulation tool to estimate energy balances of device integrated PV systems under indoor irradiation conditions. Proceedings of 23rd European Photovoltaic Solar Energy Conference, PV Systems, Off-grid applications, Valencia, Spain, 2008, pp. 3338–3343.
- Randall, J. F. 2005. Designing indoor solar products: photovoltaic technologies for AES. PhD disseration, John Wiley and Sons, Ltd, ETHZ Switzerland.
- European Commission JRC- Photovoltaic Geographical Information System - Interactive Maps. Available at http://re.jrc.ec.europa.eu/pvgis/apps4/pvest.php (accessed October 30, 2015).
- Wen, J., and T. F. Smith. 2002. Absorption of solar energy in a room. Sol. Energy72:283–297.
- Reich, N. H., van Sark W. G. J. H. M., E. Alsema, R. Lof, R. Schropp, W. Sinke, et al. 2009. Crystalline silicon cell performance at low light intensities. Sol. Energy Mater. Sol. Cells93: 1471–1481.
- Reich, N. H., vanSark W. G. J. H. M., and W. C. Turkenburg. 2011. Charge yield potential of indoor-operated solar cells incorporated into product integrated photovoltaic (PIPV). Renew. Energy36:642–647.
- Randall, J. F., and J. Jacot. 2002. The performance and modelling of 8 photovoltaic materials under variable light intensity and spectra. Published in World Renewable Energy Congress VII & Expo.
- Apostolou, G., M. Verwaal, and A. H. M. E. Reinders. 2014. Estimating the performance of product integrated photovoltaic (PIPV) cells under indoor conditions for the support of design processes. Proceedings of 40th IEEE Photovoltaic Specialists Conference, Poster Presentation, Denver 2014, Colorado, Pp. 0742–0747. doi: 10.1109/PVSC.2014.6925027
- Besheerab, A. H., A. M. Kassemc, and A. Y. Abdelazizd. 2014. Single-diode model based photovoltaic module: analysis and comparison approach. Electr. Pow. Compon. Syst.42:1289–1300.
- Rekioua, D., and E. Matagne. Optimization of photovoltaic power systems – modelization, simulation and control. Springer London Dordrecht Heidelberg New York.
- Quaschning, V. Understanding renewable energy systems, Volume 2, First published by Earthscan in the UK and USA in 2005.
- Green, M. A., K. Emery, Y. Hishikawa, W. Warta, and E. D. Dunlop. 2015. Solar cell efficiency tables (Version 45). Prog. Photovolt: Res. Appl.23:1–9.
- Li, Y., N. J. Grabham, S. P. Beeby, and M. J. Tudor. 2015. The effect of the type of illumination on the energy harvesting performance of solar cells. Sol. Energy111:21–29.
Document information
Published on 01/06/17
Submitted on 01/06/17
Licence: Other
Share this document
Keywords
claim authorship
Are you one of the authors of this document?
